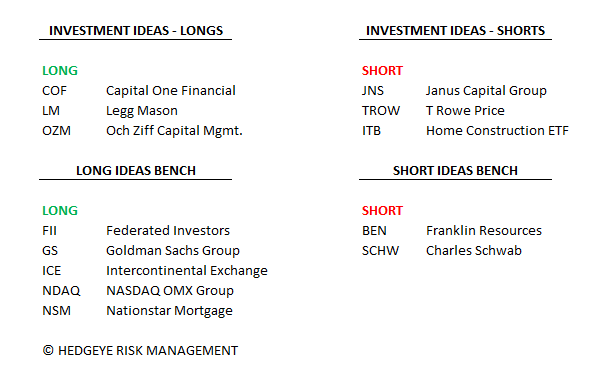
Current Best Ideas:
Key Takeaway:
Our last three weekly risk monitors have been titled:
"Danger Zone" - 10/13/14
"Don't Get Complacent" - 10/6/14
"Risk is Rising" - 9/29/14
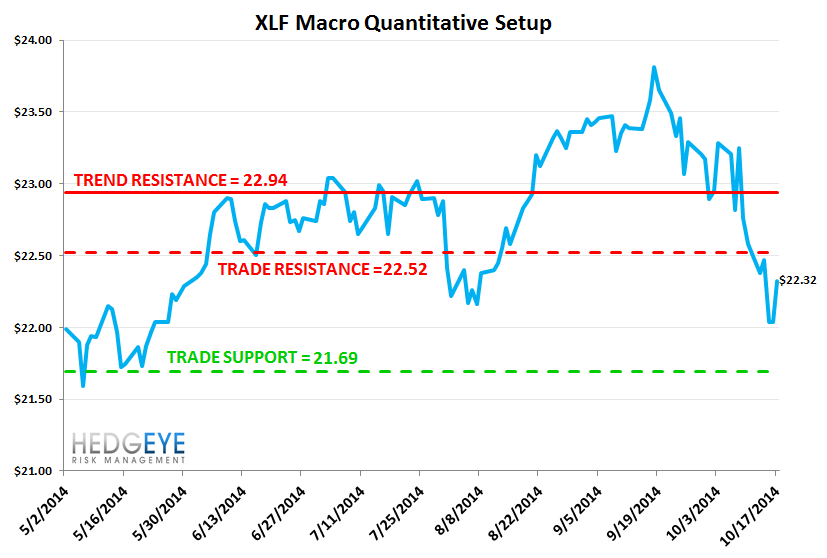
The XLF is down 6.3% on a m/m basis and was down 1.2% last week. A confluence of factors are responsible including European growth slowing, US growth concerns, and, more recently, apprehension about Ebola spreading globally. We've been flagging rising risk for the last 3 weeks (see our note titles above). This morning, the short-term outlook remains challenging. For reference, our Macro team’s quantitative setup in the XLF shows 0.9% upside to TRADE resistance and 2.8% downside to TRADE support. The risk monitor is suggesting a bearish intermediate term outlook.
Financial Risk Monitor Summary
• Short-term(WoW): Positive / 4 of 12 improved / 3 out of 12 worsened / 5 of 12 unchanged
• Intermediate-term(WoW): Negative / 4 of 12 improved / 6 out of 12 worsened / 2 of 12 unchanged
• Long-term(WoW): Negative / 3 of 12 improved / 4 out of 12 worsened / 5 of 12 unchanged
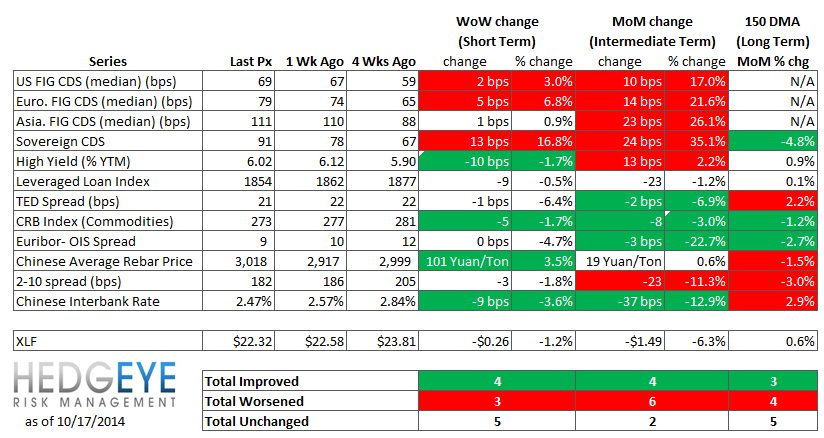
1. U.S. Financial CDS - Swaps tightened for 17 out of 27 domestic financial institutions on the week. Large cap US Financials were little changed over the course of the week with an average change of zero bps. On a m/m basis, however, swaps are wider by 10 bps. Morgan Stanley is leading the charge higher, rising by 13 bps on the month and 3 bps on the week.
Tightened the most WoW: TRV, CB, ALL
Widened the most WoW: GNW, PRU, LNC
Tightened the most WoW: ACE, CB, AON
Widened the most MoM: AXP, AIG, MS

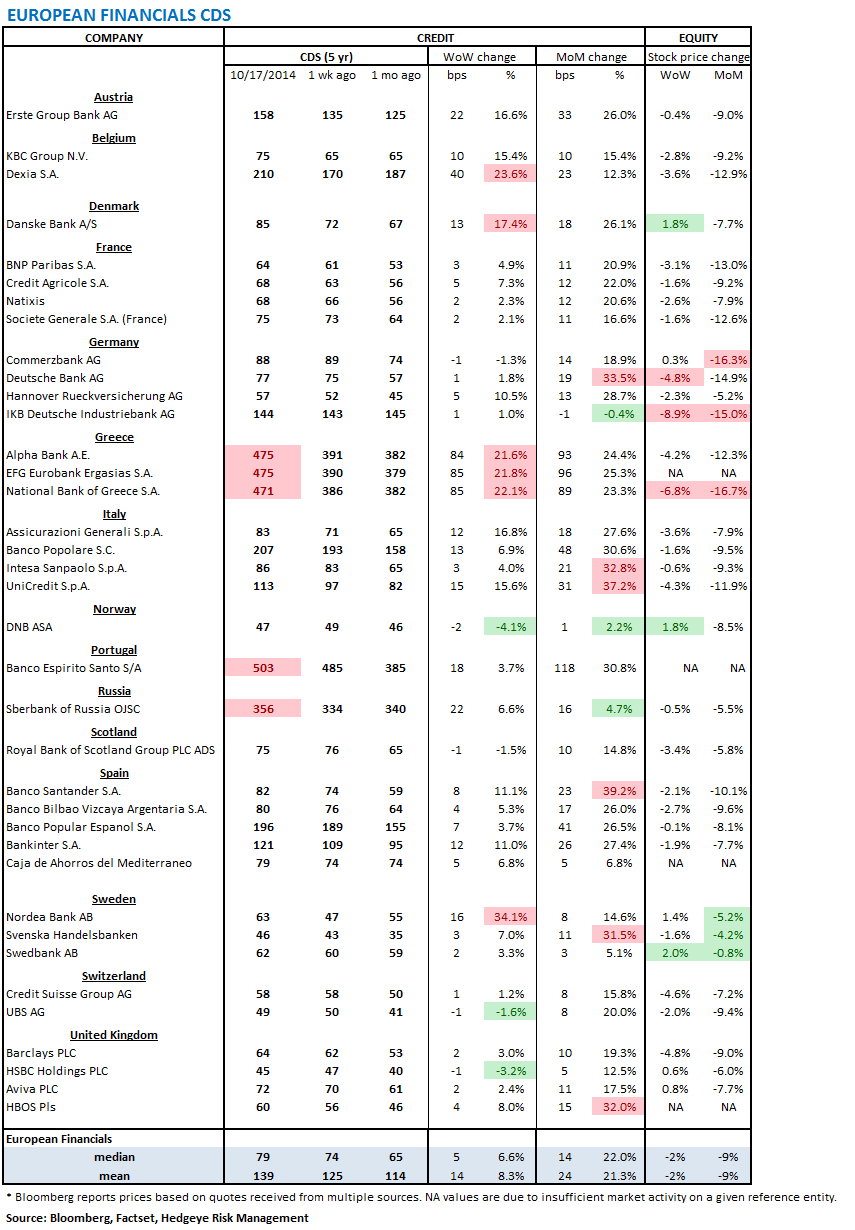
2. European Financial CDS - Swaps were sharply wider in Europe last week. Much of the weakness was driven by Greek banks, which widened by an average 85 bps on the week.
3. Asian Financial CDS - Indian bank swaps were the most changed on the week, rising by an average of 7 bps on the week. Chinese bank swaps remain the most changed on the month.

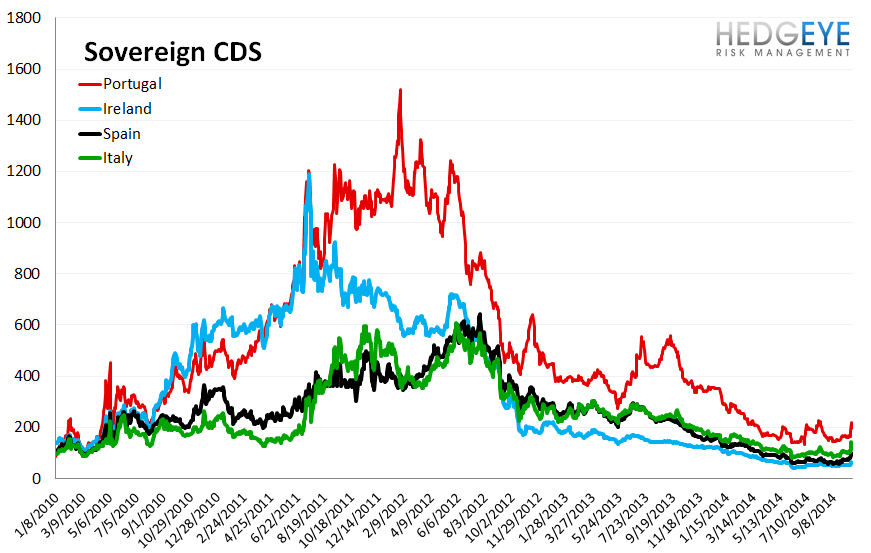
4. Sovereign CDS – European Sovereign swaps widened notably last week. Portugal and Spain saw swaps widen 28 and 18 bps, respectively. Meanwhile, Italian and French swaps were wider by 14 and 10 bps. The US and Japan also widened by 2 and 4 bps.


5. High Yield (YTM) Monitor – High Yield rates fell 10.1 bps last week, ending the week at 6.02% versus 6.12% the prior week.

6. Leveraged Loan Index Monitor – The Leveraged Loan Index rose 8.0 points last week, ending at 1854.

7. TED Spread Monitor – The TED spread fell 1.4 basis points last week, ending the week at 20.8 bps this week versus last week’s print of 22.2 bps.

8. CRB Commodity Price Index – The CRB index fell -1.7%, ending the week at 273 versus 277 the prior week. As compared with the prior month, commodity prices have decreased -3.0% We generally regard changes in commodity prices on the margin as having meaningful consumption implications.

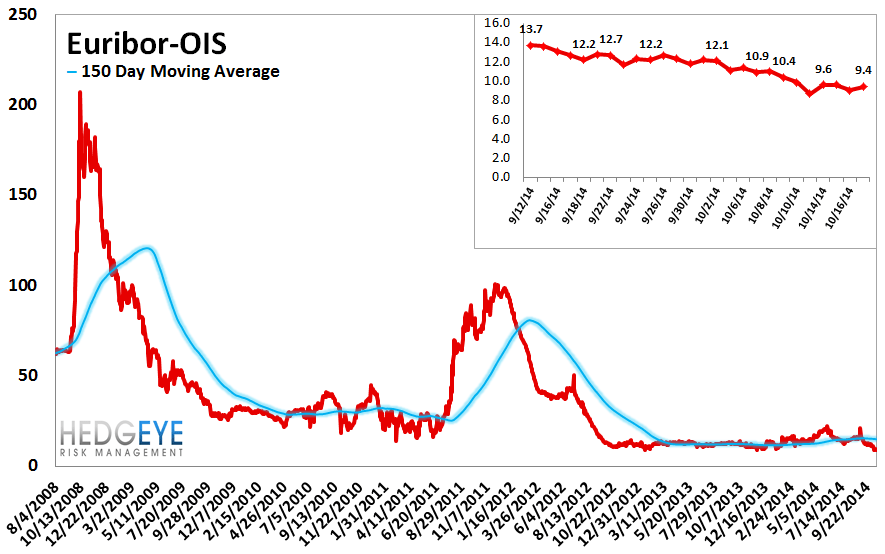
9. Euribor-OIS Spread – The Euribor-OIS spread (the difference between the euro interbank lending rate and overnight indexed swaps) measures bank counterparty risk in the Eurozone. The OIS is analogous to the effective Fed Funds rate in the United States. Banks lending at the OIS do not swap principal, so counterparty risk in the OIS is minimal. By contrast, the Euribor rate is the rate offered for unsecured interbank lending. Thus, the spread between the two isolates counterparty risk. The Euribor-OIS spread was unchanged at 9 bps.
10. Chinese Interbank Rate (Shifon Index) – The Shifon Index fell 9 basis points last week, ending the week at 2.47% versus last week’s print of 2.57%. The Shifon Index measures banks’ overnight lending rates to one another, a gauge of systemic stress in the Chinese banking system.

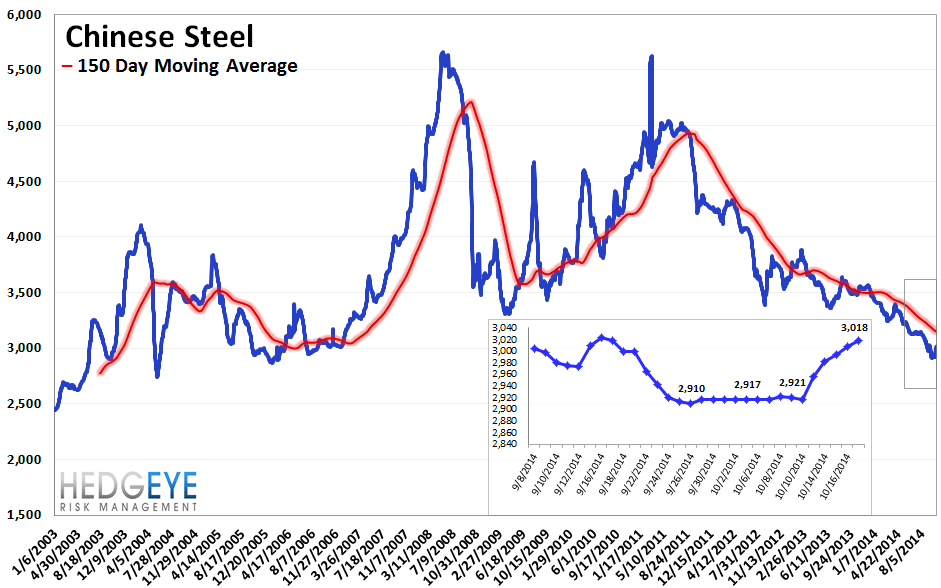
11. Chinese Steel – Steel prices in China rose 3.5% last week, or 101 yuan/ton, to 3018 yuan/ton. We use Chinese steel rebar prices to gauge Chinese construction activity, and, by extension, the health of the Chinese economy.
12. 2-10 Spread – Last week the 2-10 spread tightened to 182 bps, -3 bps tighter than a week ago. We track the 2-10 spread as an indicator of bank margin pressure.

13. XLF Macro Quantitative Setup – Our Macro team’s quantitative setup in the XLF shows 0.9% upside to TRADE resistance and 2.8% downside to TRADE support.
Joshua Steiner, CFA
Jonathan Casteleyn, CFA, CMT
