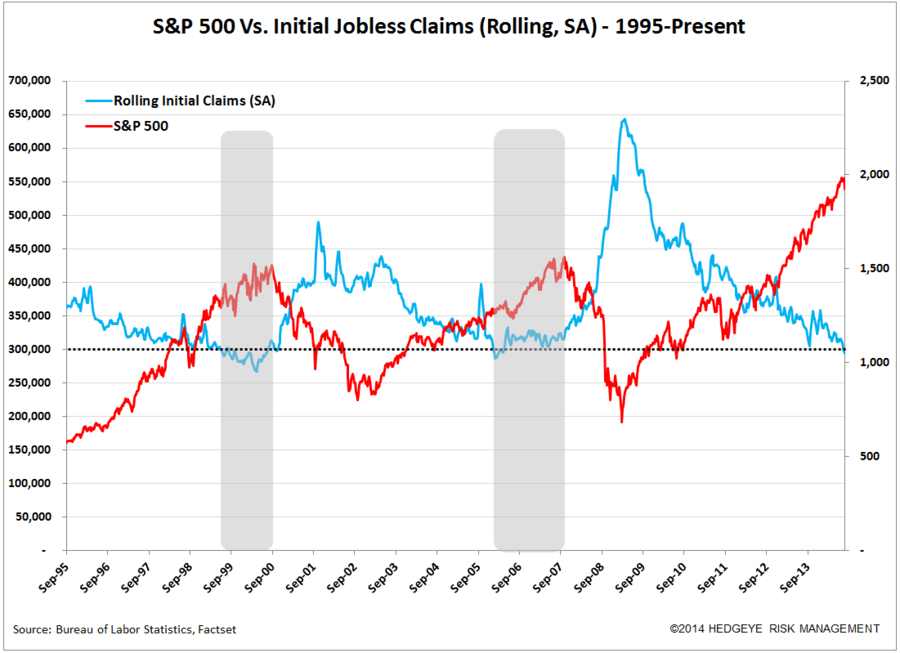
Initial jobless claims are now running at sub-300k on a rolling SA (seasonally adjusted) basis for the second week in a row. Based on the chart below, in the past two instances (1999-2000 and 2006-2007) the market went on to advance for 12-18 months after rolling initial claims first dropped below 300k. We're not suggesting that history will repeat exactly; rather, we're just offering this as context.
Initial claims are a leading indicator for the economy, whereas the unemployment rate is a lagging indicator. The market is also a leading indicator for the economy. As such, we use claims principally as a leading indicator for the economy and as a coincident indicator for the market.
We think that by looking at both the aboslute level and the trend (and inflections therein) in claims in real time and evaluating it relative to past cycles we can have a decent bearing on where we are in the current cycle.