Key Callouts:
The long end of the yield curve is seemingly at odds with most of the rest of the data YTD. While long-term interest rates continue to fall, most other risk measures we track show signs of ongoing stability across markets and geographies. Why is this? We suspect it has to do with the Fed's tapering, which is causing the bond market to follow the same course it has taken after the end of both QE1 and QE2. We'll have a note out later today walking through this dynamic in greater detail.
Unfortunately, while the "coast is clear" from the standpoint of risk, the reality is that much of the Financials sector is highly positively correlated to long-term interest rates, and so it's tough to make money on the long side when the 10-Year yield is falling. Finding ways to do so will also be explored in our note coming out later today.
* High Yield (YTM) Monitor – High Yield rates fell 4.1 bps last week, ending the week at 5.58% versus 5.62% the prior week.
* Leveraged Loan Index Monitor – The Leveraged Loan Index rose 8.0 points last week, ending at 1862.
* 2-10 Spread – Last week the 2-10 spread tightened to 216 bps, -7 bps tighter than a week ago.
Financial Risk Monitor Summary
• Short-term(WoW): Positive / 5 of 12 improved / 2 out of 12 worsened / 5 of 12 unchanged
• Intermediate-term(WoW): Positive / 6 of 12 improved / 3 out of 12 worsened / 3 of 12 unchanged
• Long-term(WoW): Positive / 4 of 12 improved / 3 out of 12 worsened / 5 of 12 unchanged

1. U.S. Financial CDS - Swaps tightened for 25 out of 27 domestic financial institutions. The Global US banks (with the exception of BAC, which widened by 1 bps) were tighter, by an average of 2 bps w/w, and 5 bps on a m/m basis. The specialty finance companies we track were tighter on the week and on the month, with the biggest move coming from the mortgage insurer RDN, which tightened by 10 bps w/w. The bond guarantors saw w/w improvements across the board. Notably improved were AGO, whose swaps tightened by 10 bps w/w, and MBI, whose swaps tightened by 6 bps w/w.
Tightened the most WoW: MET, HIG, AIG
Widened the most/ tightened the least WoW: BAC, UNM, AON
Tightened the most WoW: AIG, XL, PRU
Widened the most MoM: MBI, SLM, BAC

2. European Financial CDS - All European swaps, with the exception of the Greek banks and three Swedish banks, tightened over the past week. Most of the 31 swaps that tightened did so by a notable amount. On average, French swaps tightened by 7 bps, German by 8 bps, Italian by 9 bps, Portuguese by 14 bps, Scottish by 16 bps, Spanish by 9 bps, and UK by 6 bps. In contrast to the past couple of weeks, Greek banks widened considerably w/w, by an average of 48 bps. The widening of Swedish banks was nominal, with three banks widening by 1 bps each, and the fourth tightening by 1 bps.

3. Asian Financial CDS – Last week Chinese and Indian banks tightened notably, by averages of 4 bps and 9 bps, respectively. Japanese banks were a mixed bag, with Nomura Holdings tightening by 5 bps w/w and Daiwa wideneing by 2 bps on a weekly basis.

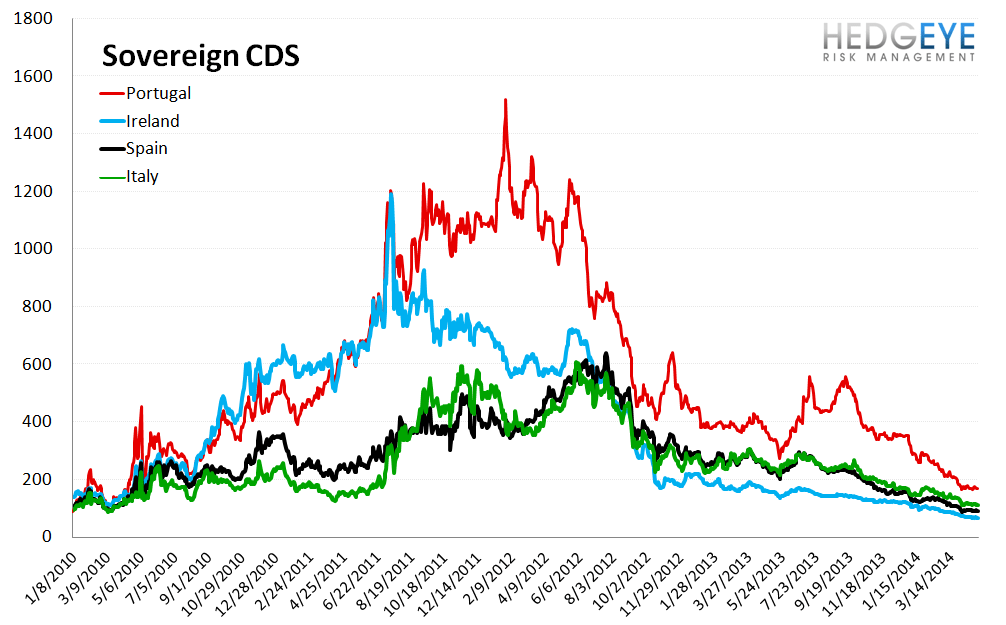
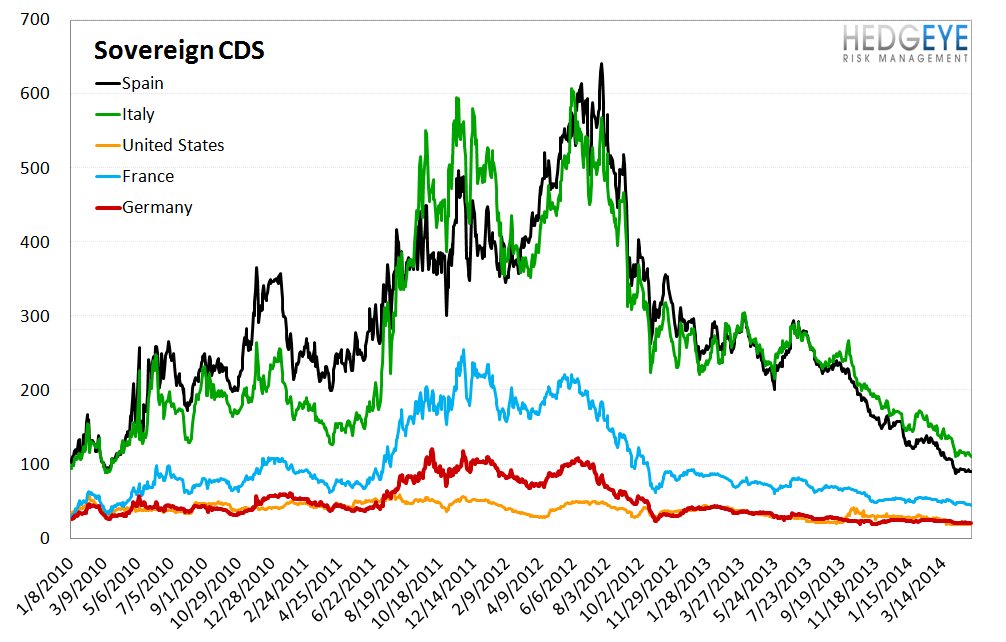
4. Sovereign CDS – Sovereign swaps mostly tightened over last week. Italian sovereign swaps tightened by -3.9% (-4 bps to 111 ) and American sovereign swaps widened by 0.7%.

5. High Yield (YTM) Monitor – High Yield rates fell 4.1 bps last week, ending the week at 5.58% versus 5.62% the prior week.

6. Leveraged Loan Index Monitor – The Leveraged Loan Index rose 8.0 points last week, ending at 1862.

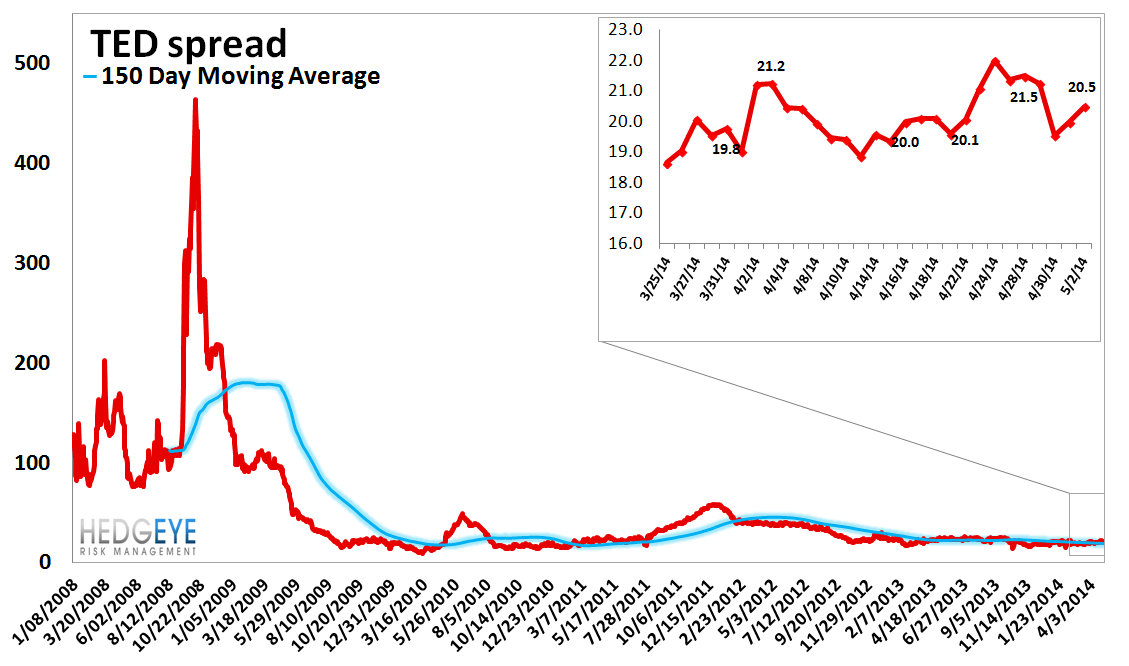
7. TED Spread Monitor – The TED spread fell 0.9 basis points last week, ending the week at 20.5 bps this week versus last week’s print of 21.36 bps.
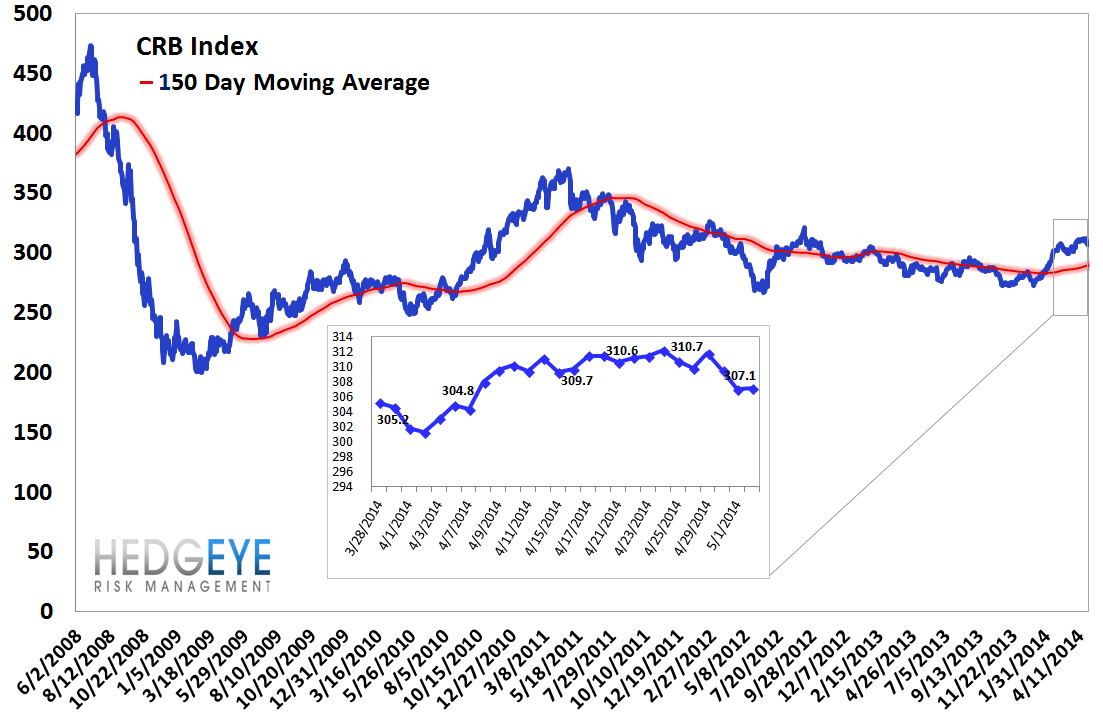
8. CRB Commodity Price Index – The CRB index fell -1.4%, ending the week at 307 versus 311 the prior week. As compared with the prior month, commodity prices have increased 1.3% We generally regard changes in commodity prices on the margin as having meaningful consumption implications.
9. Euribor-OIS Spread – The Euribor-OIS spread (the difference between the euro interbank lending rate and overnight indexed swaps) measures bank counterparty risk in the Eurozone. The OIS is analogous to the effective Fed Funds rate in the United States. Banks lending at the OIS do not swap principal, so counterparty risk in the OIS is minimal. By contrast, the Euribor rate is the rate offered for unsecured interbank lending. Thus, the spread between the two isolates counterparty risk. The Euribor-OIS spread widened by 2 bps to 16 bps.

10. Chinese Interbank Rate (Shifon Index) – The Shifon Index rose 19 basis points last week, ending the week at 2.5% versus last week’s print of 2.31%. The Shifon Index measures banks’ overnight lending rates to one another, a gauge of systemic stress in the Chinese banking system.

11. Chinese Steel – Steel prices in China rose 0.2% last week, or 5 yuan/ton, to 3337 yuan/ton. We use Chinese steel rebar prices to gauge Chinese construction activity, and, by extension, the health of the Chinese economy.

12. 2-10 Spread – Last week the 2-10 spread tightened to 216 bps, -7 bps tighter than a week ago. We track the 2-10 spread as an indicator of bank margin pressure.

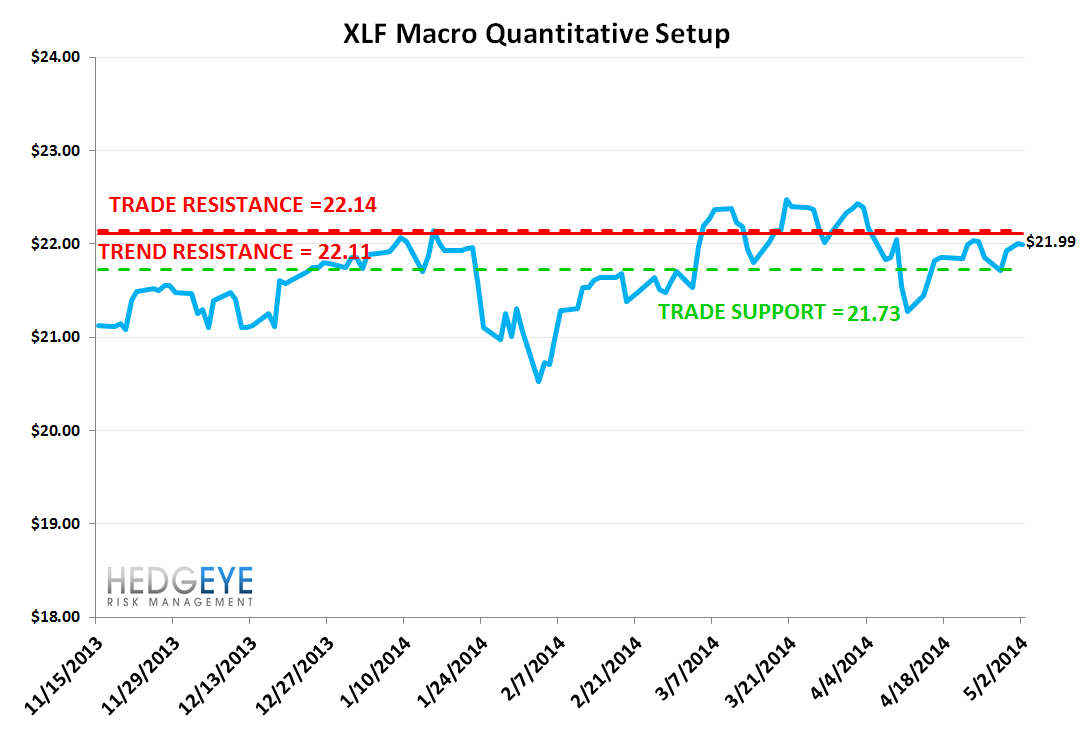
13. XLF Macro Quantitative Setup – Our Macro team's quantitative setup in the XLF shows 0.7% upside to TRADE resistance of $22.14 and 1.2% downside to TRADE support of $21.73.
Joshua Steiner, CFA
Jonathan Casteleyn, CFA, CMT
