Investment Company Institute Mutual Fund Data and ETF Money Flow:
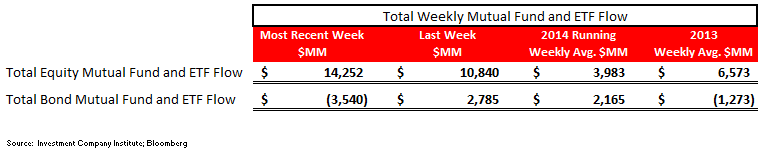
In the most recent week, equity mutual funds had another solid inflow albeit just inline with the year-to-date averages with bonds funds showing improving subscriptions, well above the year-to-date mean:
Total equity mutual funds produced another strong week of inflow with $5.3 billion of net subscriptions, a slight acceleration from the $4.9 billion inflow the week prior. The $5.3 billion inflow had an international fund bias during the most recent 5 day period, with $3.4 billion flowing into international equity funds and $1.9 billion flowing into domestic stock funds. The 2014 running weekly average inflow for equity mutual funds is now $4.9 billion, an improvement from the $3.0 billion weekly average inflow for 2013.
Fixed income mutual funds also had net inflows during the 5 day period ending March 5th with $3.7 billion flowing into all fixed income funds. The breakout of improving bond fund inflow amounted to $2.9 billion into taxable products and a $756 million inflow into tax-free or municipal products, the 8th consecutive week of inflow into munis after 33 consecutive weeks of outflow. The 2014 weekly average for fixed income mutual funds now stands at a $1.0 billion weekly inflow, an improvement from 2013's weekly average outflow of $1.5 billion but a far cry from the $5.8 billion weekly average inflow from 2012 (our view of the blow off top in bond fund inflow).
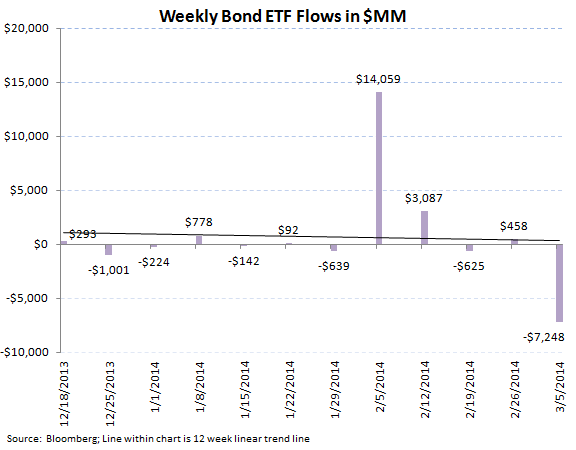
ETFs had mixed trends during the week, with a strong week of subscriptions in stock ETFs with $8.8 billion in net inflow with bond ETFs experiencing a sharp $7.2 billion outflow, the biggest bond ETF withdrawal in our 18 month data set. The 2014 weekly averages are now a $978 million weekly outflow for equity ETFs and a $1.0 billion weekly inflow for fixed income ETFs.
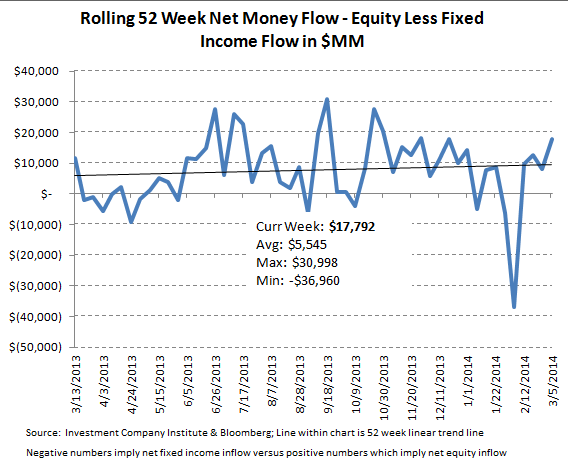
The net of total equity mutual fund and ETF trends against total bond mutual fund and ETF flows totaled a positive $17.7 billion spread for the week ($14.2 billion of total equity inflow versus the $3.5 billion outflow within fixed income; positive numbers imply greater money flow to stocks; negative numbers imply greater money flow to bonds). The 52 week moving average has been $7.4 billion (more positive money flow to equities), with a 52 week high of $30.9 billion (more positive money flow to equities) and a 52 week low of -$36.9 billion (negative numbers imply more positive money flow to bonds for the week).
Continued positive equity mutual fund inflow currently supports our long recommendation on T Rowe Price (TROW) which benefits from this trend with a leading retail equity mutual fund franchise. In addition, we recently added Legg Mason (LM) to our Best Ideas list on the long side to capture the nascent trends on the institutional side of the industry, which is seeing a shift in asset allocation into fixed income and alternatives as pensions de-risk away from equities (see our Legg report here).
Mutual fund flow data is collected weekly from the Investment Company Institute (ICI) and represents a survey of 95% of the investment management industry's mutual fund assets. Mutual fund data largely reflects the actions of retail investors. Exchange traded fund (ETF) information is extracted from Bloomberg and is matched to the same weekly reporting schedule as the ICI mutual fund data. According to industry leader Blackrock (BLK), U.S. ETF participation is 60% institutional investors and 40% retail investors.

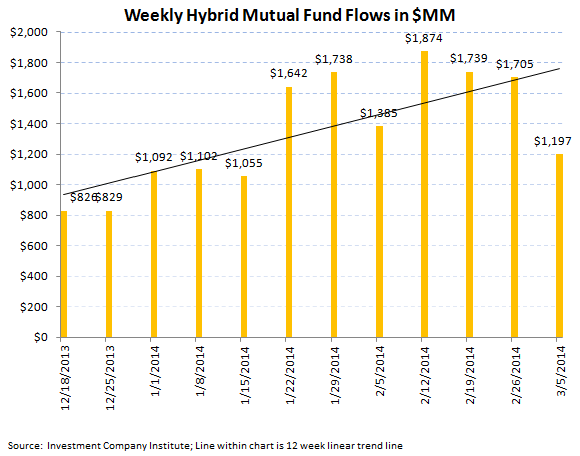
Most Recent 12 Week Flow in Millions by Mutual Fund Product:


Most Recent 12 Week Flow Within Equity and Fixed Income Exchange Traded Funds:

Net Results:
The net of total equity mutual fund and ETF trends against total bond mutual fund and ETF flows totaled a positive $17.7 billion spread for the week ($14.2 billion of total equity inflow versus the $3.5 billion outflow within fixed income; positive numbers imply greater money flow to stocks; negative numbers imply greater money flow to bonds). The 52 week moving average has been $7.4 billion (more positive money flow to equities), with a 52 week high of $30.9 billion (more positive money flow to equities) and a 52 week low of -$36.9 billion (negative numbers imply more positive money flow to bonds for the week).
Continued positive equity mutual fund inflow currently supports our long recommendation on T Rowe Price (TROW) which benefits from this trend with a leading retail equity mutual fund franchise. In addition, we recently added Legg Mason (LM) to our Best Ideas list on the long side to capture the nascent trends on the institutional side of the industry, which is seeing a shift in asset allocation into fixed income and alternatives as pensions de-risk away from equities (see our Legg report here).
Jonathan Casteleyn, CFA, CMT
Joshua Steiner, CFA
