The details show that June was even better than the headline. July should be more of the same.
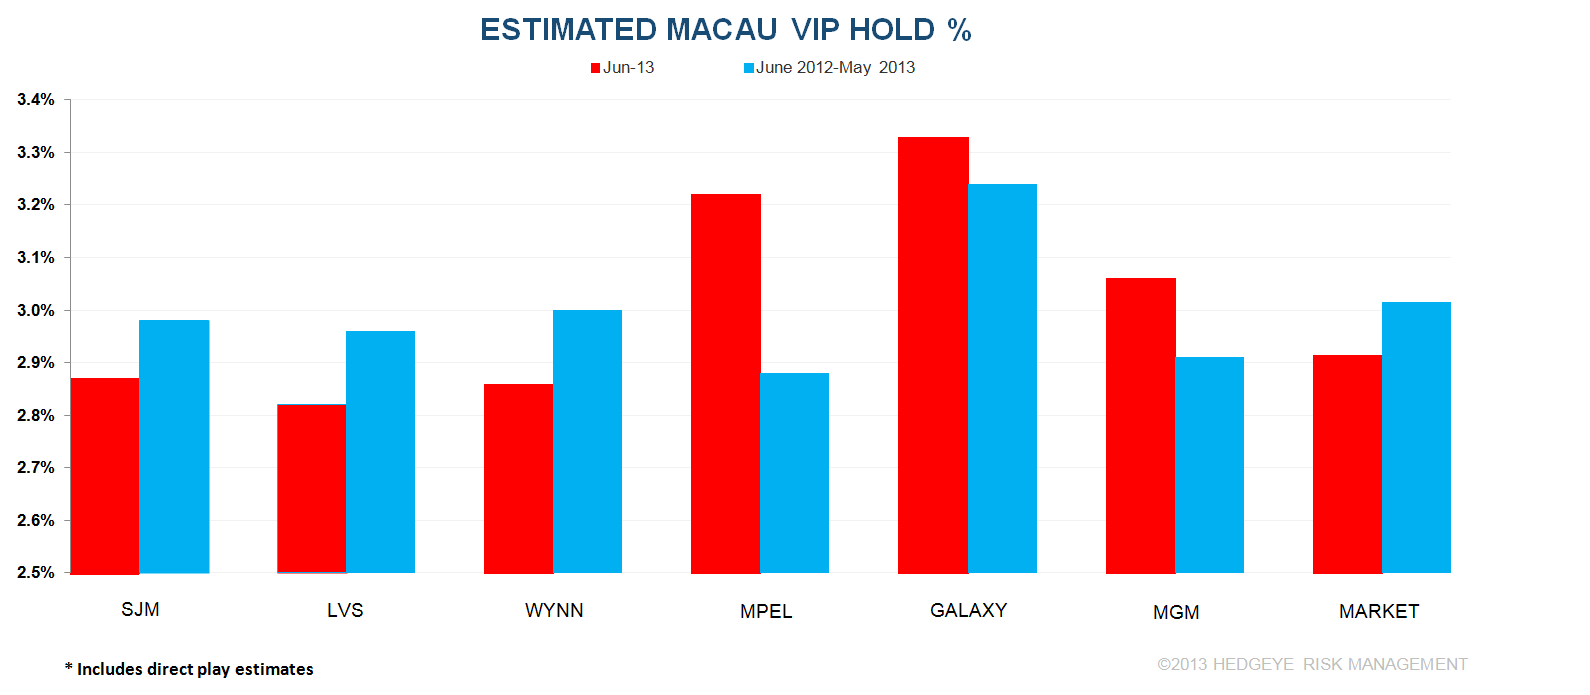
June GGR grew 21.1% YoY to HK$27.45 billion (US$ 3.54 billion). We estimate that including direct play, VIP hold was 3.03% versus a normalized 3.00%. With normal VIP hold in both periods, GGR growth would have been 21.7% (similar to what was reported). We expect the +20% growth to extend into July.
Our favorite names are MPEL and MGM, both of whom had solid months. MPEL gained share due in part to higher hold but Mass growth of 65% led the market. MGM's June was outstanding. Mass, VIP volume, and slot share were all above normal. GGR grew 41%, the highest in almost 2 years. Wynn was a laggard with only 4% GGR growth and share about 70bps below recent trend. Here is the detail.
YOY TABLE OBSERVATIONS
Total table revenue grew 22% YoY. Mass market growth continued its streak of around 30% growth rate, up 32% in June. VIP volume and win rose 18%, the highest volume growth since January 2012.
LVS
Table win grew 33%, lead by 87% growth at SCC. Mass revs remained strong at 55% while VIP RC grew 33%. Including direct play, we estimate that LVS held at 2.8% in June compared to 3.1% last June, assuming direct play of 16% vs. 22% last year. Four Seasons was the only property that held better than last June's.
- Sands climbed 9%
- Mass grew 30%
- VIP revenue fell 5%
- Sands held at 3.1% vs 3.4% in the same period last year. We assume 11% direct play in June vs 9% in June 2012.
- Junket RC grew 4%, ending a three month losing streak
- Venetian grew 28%
- Mass increased 35%
- VIP revenue grew 21%
- Junket VIP RC gained 40%, largest growth since May 2011
- Assuming 27% direct play, hold was 3.3% compared to 3.8% in June 2012, assuming 28% direct play
- Four Seasons lost 2%
- Mass revenue declined 33%
- VIP revenue grew 7% but Junket VIP RC declined 5%. June hold (assuming 11% direct play) was 2.6% vs 2.2% in June 2012 when direct play was 16%.
- Sands Cotai Central rocketed 87% higher
- Mass jumped 186% to $96MM, a new monthly high
- VIP revenues grew 47%
- Junket RC volume of $4.4BN, up 87% YoY
- If we assume that direct play was 11%, hold would have been 2.5%
MPEL
MPEL had a solid month, lobbing in the 2nd best table growth of 38%. Mass continued to be white-hot at 65% (1st in the market) while VIP growth was 29%. We estimate that MPEL held at 3.22% vs 2.83% last June. Estimated direct play was 10% in line with last year.
- Altira table revenues grew 18%. Mass rose 14% while VIP saw a 18% YoY increase.
- VIP RC was flat
- We estimate that hold was 3.4%, compared to 2.9% in the prior year
- CoD table revenues grew 47% YoY
- Mass increased 72%, continuing its impressive streak of strong YoY double-digit gains since the property opened
- VIP win grew 46% and RC grew 25%
- Assuming a 14% direct play level, hold was 3.1% in June compared to 2.8% last year (assuming 15% direct play)
WYNN
Wynn table revenues grew 6%
- VIP revenues grew 9%, while VIP RC increased 6%
- Wynn held at 2.9% vs 2.9% last June
- Mass revenues fell 3%, the 1st drop since June 2012
MGM
MGM had the strongest performance in June, growing 44% in table revenues.
- We estimate that hold was 3.1% adjusted for direct play of 7% vs hold of 3.4% last year assuming 9% direct play
- VIP RC and Mass grew 64% and 37%, respectively
GALAXY
Galaxy was the laggard in June with tables revenues growth of 6%. VIP RC had the worst market performance, only 3% gain. On the bright side, Mass growth was strong at 41%. Hold was 3.3% in June 2013 vs. 3.6% last year.
- StarWorld table revenues rose 6%
- Mass soared 49%
- VIP gained 1%.
- Junket RC rose 7%
- Hold was 3.3% vs 3.5% last year
- Galaxy Macau's table revenues grew 5%
- Mass had another great month at 45% growth
- VIP saw a 3rd consecutive decline at -5% but RC rose 2%
- Hold was 3.3% vs 3.6% last June
SJM
Total table revenue grew 18%, with mass and VIP growth of 6% and 25%, respectively. RC volume also gained 16%. SJM held at 2.9% vs 2.7% last year.
SEQUENTIAL MARKET SHARE - May to June (property specific details are for table share while company-wide statistics are calculated on total GGR, including slots):
LVS
Market share lost 50bps to 20.5%. June’s share is below its 6-month average of 21.1% and better than its 2012 average share of 19.0%.
- Sands' share gained 70bps to 3.5%. For comparison purposes, 2012 share was 3.9% and 6M trailing average share was 3.2%.
- Mass share dropped 50bps to 5.4%
- VIP rev share increased 120bps to 2.7%
- RC share was 2.4%, +20bps MoM
- Venetian’s share fell 70bps to 7.8%. 2012 share was 7.9% and 6 month trailing share was 8.4%.
- Mass share decreased 90bps to 13.5%
- VIP share lost 60bps to 5.4%
- Junket RC share was unchanged at 3.9%
- FS gained lost 150bps to 2.2%. This compares to 2012 share of 3.7% and 6M trailing average share of 3.2%.
- VIP was lost 200bps to 2.7%
- Mass share fell 50bps to 1.0%, matching an all-time low
- Junket RC lost 110bps to 3.0%
- Sands Cotai Central's table market share gained 90bps to 6.4%, which compares to the 6M trailing average share of 5.9%.
- Mass share improved 120bps to 9.4%, a new high
- VIP share climbed 0.8% to 5.2%
- Junket RC share grew 50bps to 6.0%
MPEL
MPEL grew 60bps in share in June to 14.6%. Its 6 month trailing share is 14.1% and their 2012 share of 13.5%.
- Altira’s share was unchanged at 3.8%, in-line with its 6 month trailing and 2012 shares
- Mass share lost 20bps to 1.1%
- VIP gained 20bps to 5.0%
- VIP RC share fell 70bps to 4.5%
- CoD’s share rose 40bps to 10.6%, above the property’s 2012 and 6M trailing share of 9.4% and 10.2%, respectively.
- Mass market share slipped 10bps to 12.4%
- VIP share gained 60bps to 9.8%
- Junket share dropped 60bps to 8.7%
WYNN
Wynn was the largest share loser in June after rising the most in May. GGR share was 10.2%, down 180bps MoM. 2012 average share was 11.9% and their 6M trailing average share has been 11.0%.
- Mass share was fell 100bps to 6.3%
- VIP share tumbled 210bps to 11.8%
- Junket RC share dropped 50bps to 12.0%
MGM
MGM’s market share dropped 30bps to 11.0%, but still above its 6M and 2012 average of 9.9%
- Mass share gained 20bps to 8.0%
- VIP share dropped 70bps to 11.9%
- Junket RC slipped 10bps to 11.7%
GALAXY
Galaxy's share gained 0.5% to 19.3%, above its 2012 average and 6-month average share of 19.0% and 18.3%, respectively
- Galaxy Macau share improved 90bps to 10.9%
- Mass share gained 20bps to 10.6%
- VIP share improved 120bps to 11.1%
- RC share gained 100bps to 10.7%
- Starworld share lost 20bps to 7.6%
- Mass share gained 20bps to 3.6%
- VIP share dropped 30bps to 9.3%
- RC share lost 50bps to 9.0%
SJM
SJM gained 160bps to 24.5% (which was an all-time low), but still below their 2012 average of 26.7% and their 6M trailing average of 25.6%
- Mass market shares gained 180bps to 26.5%
- VIP share gained 170bps to 24.5%
- Junket RC share rose 190bps to 27.5%
Slot Revenue
Slot revenue grew 12% YoY to $139MM in June
- LVS had the best YoY growth at 36% to $45MM
- MPEL grew 25% to $28MM
- MGM gained 13% to $25MM
- GALAXY rose 6% to $14MM
- SJM dropped 8% to $13MM
- WYNN had the worst YoY slot performance, tumbling 27% to $14MM