The details of a solid November in Macau
As we already knew, Macau GGR increased 8% YoY despite a tough hold comparison. VIP hold was slightly below normal in November 2012 but well below November 2011. Overall, results in November were better than the headline suggests. Once again, Mass revenue led the way, up 33% while VIP revenue declined slightly (less than 1%) for the 2nd consecutive month and the last 4 out of 5 months. VIP chips (volume) was up a solid 7%, however. Overall, November was a decent month and we expect December to be even better. However, we remain concerned about the upcoming smoking restrictions, potential junket crackdown, the weak performance of the SSE, and stabilizing Mass hold %.
We estimate that total direct play this month accounted for 6.7% of the market, compared with 6.9% in November 2011. The total VIP market held at 2.90% vs. 3.11% in November 2011. Adjusting for direct play and theoretical hold of 2.85% in both months, November revenues would have increased 14% YoY.
LVS was the clear winner this month, on many fronts. Here are some company-specific analysis:
Sands China
- Market share was a strong 20.8%, up from 15.6% last year and in-line with October’s strong showing. We continue to believe that Sands will post fairly consistent share improvement over the next 12 months on a hold-adjusted basis.
- Mass share was equally impressive at 27.7%, 2nd highest in last 3 years.
- Not surprisingly Sands YoY GGR growth of 44% led the market but more impressively, its Mass business grew a whopping 75%.
- VIP hold was slightly below normal and well below last year making the VIP growth even more impressive
Wynn
- Wynn struggled again this past month with GGR down 2% and Mass only up 6%.
- Market share was in-line with its 12 month average but only because Wynn held well above normal, albeit slightly below November 2011
- Mass share fell to 7.5%, an all-time low
MPEL
- Overall a solid month for MPEL: GGR share was slightly above the 12-month average but Mass share grew to 12.9% (driven by CoD), an all-time high
- GGR grew 15% YoY and Mass increased 40% YoY
- VIP hold was well below normal and last November’s hold so the month could’ve been even better for MPEL
MGM
- Market share rebounded from October’s abysmal 8.9% but was still lower than the 12 month average
- Mass share was only 6.9%, near an all-time low
- MGM GGR fell for the 2nd straight month – not good
Y-O-Y TABLE OBSERVATIONS
Total table revenues grew 8% in November. Mass revenue growth was strong at 33%, just a little above the 6M trailing average of 31%. VIP revenues were flat YoY. Over the last 6 months VIP revenue growth has bounced around between -5% and +7% and averaged less than 1% growth. Junket RC volume grew 7% YoY, while hold was down YoY. We expect December’s growth rate to pick up to 12%.
LVS
Table revenues grew 45% YoY (Mass +75%; VIP+29%), garnering the best growth in the market for the 5th straight month. We estimate that Sands China held in the normal range this year at 2.86% vs. 3.00% last year, adjusted for direct play of 18%.
- Sands table revenue was flat YoY, aided by high hold and a very easy comparison
- Mass grew 4%
- VIP was down 3%. We estimate that Sands held at 3.27% in November compared to 2.49% in the same period last year. We assume 9% direct play in November vs. 12% in November 2011.
- Junket RC plunged 23% YoY; aside from September, 11 of the 12 trailing months have seen YoY declines in RC volume.
- Venetian table grew 5% YoY, negatively impacted by a difficult hold comparison.
- Mass increased 43%, the property's best growth rate in 7 months
- VIP was down 18%
- Junket VIP RC fell 6%, marking the 10th consecutive month of declines at Venetian. In the 12 month period spanning from September 2008-2009, Venetian saw 10 months where junket RC volumes fell.
- Assuming 30% direct play, hold was 2.91% compared to 3.43% in November 2011, assuming 28% direct play (in-line with 4Q11)
- Four Seasons continued to perform well, growing 36% YoY despite low hold
- Mass revenues grew 51%
- VIP grew 34% and Junket VIP RC rose 64% YoY (on top of 250% growth in November 2011)
- If we assume direct play of 16%, in-line with the first 3Q of 2012, hold in November was 2.65% vs. 2.81% in November 2011 when direct play was ~27%
- Sands Cotai Central produced $147MM in November, down from a record setting $200MM in October
- Mass revenue of $63MM, $9MM lower MoM, but $20MM higher than September.
- VIP revenue of $84MM
- Junket RC volume of $2,772MM, down 19% MoM, and below the $2.9BN in September
- If we assume that direct play was 9%, hold would have been 2.77%
WYNN
Wynn table revenues fell 1% YoY in November. Hold was high but last year’s comparison was even more difficult.
- Mass was up 6% flat – the worst performance of the 6 concessionaires for the 3rd consecutive month
- VIP revenues fell 2%. With the exception of September, Wynn has had YoY declines in VIP revenues for the last 7 of 8 months.
- Junket RC grew 1%, breaking 6 consecutive month of declines.
- Assuming 10% of total VIP play was direct (in-line with 3Q12), we estimate that hold was 3.44% compared to 3.53% last year (assuming 11% direct play – in-line with 4Q11)
MPEL
MPEL table revenue grew 15%, exhibiting the second best market growth. Despite an easy comparison, hold across MPEL’s 2 properties was even lower at just 2.45% vs. 2.63% last year.
- Altira revenues grew 3%, with a 5% increase in VIP offset by a 12% drop in Mass.
- VIP RC decreased 6%, marking the 12th consecutive month of declines which have averaged -18%
- We estimate that hold was 2.89%, compared to 2.62% in the prior year
- CoD table revenues grew 21% YoY, despite low hold
- Mass revenue grew an impressive 50% and VIP revenue grew 9%
- RC grew 31%
- Assuming a 15% direct play level, hold was 2.25% in November compared to 2.64% last year (assuming 15% direct play levels in-line with 4Q11)
SJM
Table revenue grew 9%
- Mass revenue was up 10% and VIP revenue grew 9%
- Junket RC grew 4%
- Hold was 3.11%, compared with 2.96% last November
GALAXY
Galaxy was the worst performer with table revenue declines of 14%. This marked the company’s 2nd consecutive month of declines in table revenues since June 2009. Mass growth still outpaced the market at 43%, but was bested by LVS for the top spot. VIP revenues dropped 25%, driven by a difficult hold comparison and slightly below normal hold. Galaxy's hold at its 2 owned properties was 2.81% vs. 3.36% in November 2011.
- StarWorld table revenues fell 20%, marking the 5thconsecutive month of declines
- Mass grew 12%, offset by a 45% drop in VIP
- Junket RC fell 23%, marking the 6th month of consecutive declines
- Hold was normal at 2.96% but the comp was difficult at 3.31% last November
- Galaxy Macau's table revenues fell 11%, the first decline at the property since opening
- Mass grew 45%
- VIP grew 12%, while RC declined 25%, marking the 4th consecutive month of declines
- Hold was low in November at 2.68% vs. a high of 3.42% last year
MGM
MGM table revenue grew 28% in November. Results were negatively impacted by low hold.
- Mass revenue grew 29%
- VIP revenue fell 28% while VIP RC were flat.
- If direct play was 8%, then October hold was 2.60% compared to 3.07% last year
SEQUENTIAL MARKET SHARE
LVS
LVS’s MoM share fell 10bps to 20.8%. November’s share was better than its 6 month trailing market share of 19.8% and better than Sands’ 2011 average share of 15.7%.
- Sands' share picked up 20bps to 3.7%. For comparison purposes, 2011 share was 4.6% and 6M trailing average share was 3.9%.
- Mass share ticked up to 5.4%
- VIP rev share increased 20bps to 3.0%
- RC share was 2.5%, up 10bps MoM
- Venetian’s share was flat at 7.9%. 2011 share was 8.4% and 6 month trailing share was 8.0%.
- Mass share improved 1.2% to 13.4%
- VIP share fell 1.4% to 5.6%
- Junket RC share ticked up 20bps to 4.1%
- FS increased 80bps to 3.7%. This compares to 2011 share of 2.2% and 6M trailing average share of 3.1%.
- VIP share 1.5% to 4.5%.
- Mass share fell 70bps to 1.9%
- Junket RC increased 20bps to 4.5%, taking the top spot among Sands’ porfolio
- Sands Cotai Central's table market share fell 1.1% to 4.9% and compares to the 6M trailing average share of 4.4%.
- Mass share of 7.0%
- VIP share of 4.0%
- Junket RC share ticked down 40bps to 4.1%
WYNN
Wynn was the biggest share gainer, increasing 2.0% to 12.1% in November, mostly due to high hold. As a point of reference, Wynn’s 2011 average is 14.1% and their 6-month trailing average is 11.8%.
- Mass market share fell 50bps to 7.5%, an all-time property low
- VIP rev share recovered 3.5% to 13.8% off of an all-time low in October
- Junket RC share decreased 70bps to 11.5%, the lowest level since October 2007
MPEL
MPEL’s lost 30bps of share in November to 13.8%, above their 6 month trailing share of 13.6% and but below their 2011 share of 14.8%.
- Altira’s share fell 30bps to 4.1%, above its 6M trailing share of 3.9% but below its 2011 share of 5.3%.
- Mass share ticked down 10bps to 1.3%
- VIP fell 20bps to 5.3%
- VIP RC share was flat at 5.4%
- CoD’s share fell 10bps to 9.5%. November’s share was above the property’s 2011 and in-line with 6M trailing share of 9.3% and 9.5%, respectively.
- Mass market share increased 1.7%to 11.7%, an all-time high for the property
- VIP share fell 90bps to 8.5%
- Junket share increased 2.0% to 10.1%
SJM
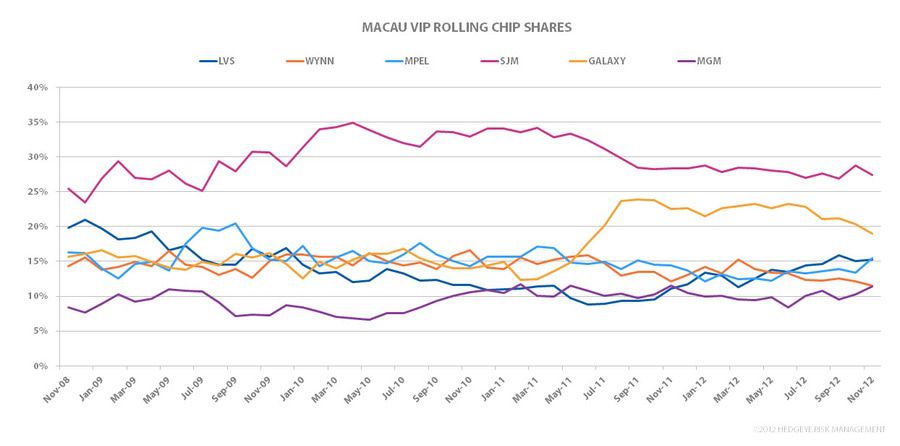
SJM’s share increased 70bps to 27.5%. November’s share compares to their 2011 average of 29.2% and its 6M trailing average of 26.3%.
- Mass market share ticked up 10bps to 30.3%, off of an all-time company low
- VIP share increased 70bps to 27.4%
- Junket RC share fell to 1.3% to 27.4%
GALAXY
Galaxy lost the most share in November, plunging 3% to 16.2%, well below its 6M trailing share average of 19.1%
- Galaxy Macau share dropped 3.7% to 8.5%, negatively impacted by low hold and a difficult comparison
- Mass share fell 60bps to 9.1%
- VIP share fell 5.0% to 8.2%
- RC share fell 80bps to 9.6%, marking the 6th consecutive month of share declines and the properties’ lowest share since July 2011
- Starworld share increased 30bps to 6.5%
- Mass share fell 90bps to 2.6%, the lowest level in 18 months
- VIP share improved 90bps to 8.2%
- RC share fell 50bps to 8.6%, the property's lowest level since July 2008
MGM
MGM gained 70bps of share to 9.6% in November, above their 6M average of 9.5% but below its 2011 share of 10.5%.
- Mass share was flat at 6.9%
- VIP share recovered 1.1% to 10.3%
- Junket RC grew 1.2% to 11.4%, the property's best share in 12 months
SLOT REVENUE
Slot revenue grew 22% YoY to $139MM in November, hitting an all-time market high.
- LVS still leads the slot market with $44MM, +34% YoY
- MGM had the highest growth at 42% to $22MM
- MPEL grew 18% YoY to $25MM
- Galaxy’s slot revenue grew 16% to $15MM
- SJM grew 27% to $18MM
- WYNN had the worst YoY performance in slots with a 14% YoY decline to $15MM