As the dollar strengthened last week, most of the commodity prices relevant to the restaurant space declined. Continuing our callout from last week, beef prices are coming down meaningfully and yesterday’s headline on the USDA quarantining two farms over last month’s discovery of mad cow disease at a California dairy farm. The publicity around Lean Fine-Textured Beef and BSE is not bullish for demand but, from what we have heard from companies, steak is still holding strong appeal for consumers. Chili’s has been reaping strong rewards from its steak promotion. As we wrote this morning in an email to clients and in our CASUAL DINING CAUTION note ahead of earnings season, we think the outperformance of casual dining versus the market is slowing and may even reverse if the employment outlook continues to deteriorate. Tomorrow’s employment data for April will be important for our thesis.
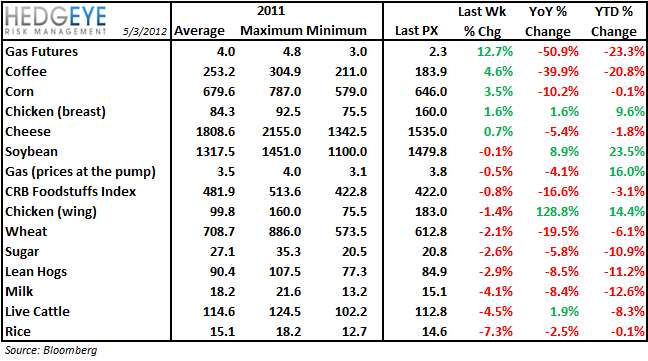
Dairy costs continue to drop which is positive for CAKE, TXRH, DPZ, and PZZA.
Domino’s called out diesel prices as being the most important factor for its commodity basket, not from a store level perspective, but in terms of the impact on its supply chain business:
“The biggest potential impact from gas prices is the effect it can have longer term on commodity prices. At the store level, franchisees may have to pay delivery drivers an increase in mileage reimbursement, but it's usually not a big impact in overall store costs. In our supply chain, we experienced the impact of diesel prices, but we also have fuel surcharges that help offset some of those costs. So while we do care about higher fuel costs, the direct impact to us and our system is smaller than many people assume.”
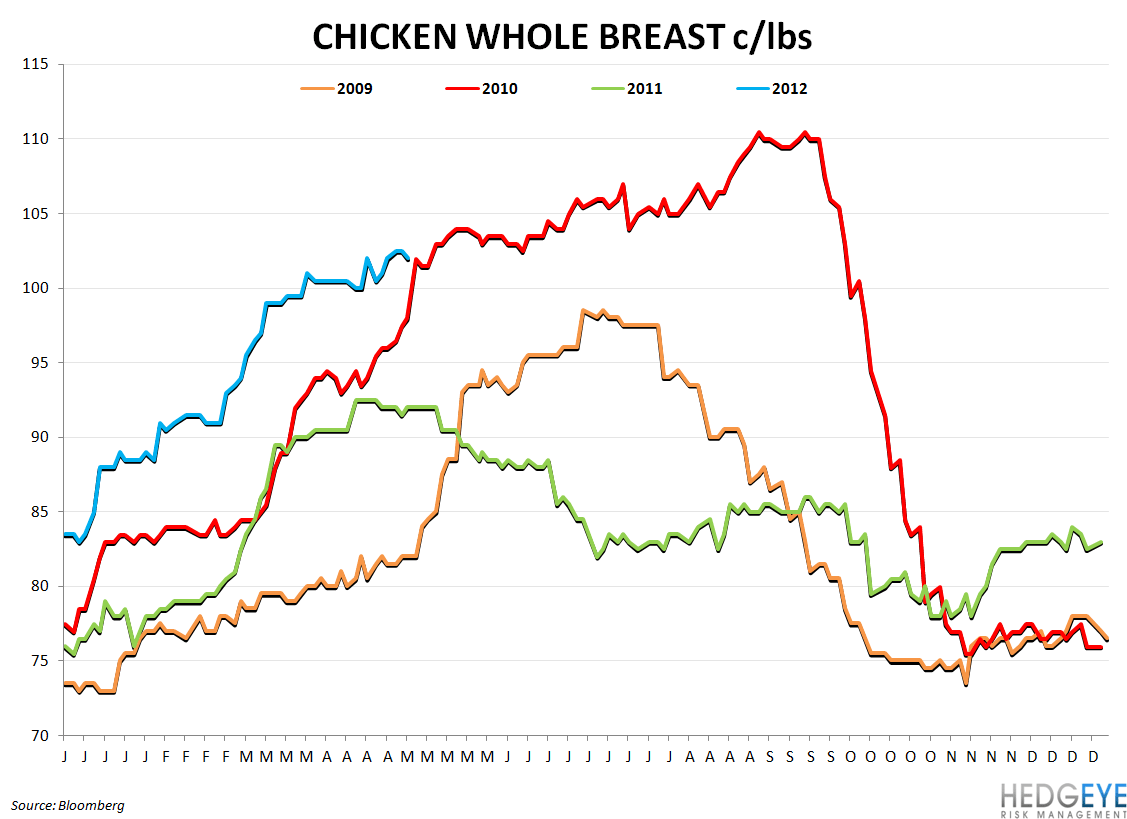
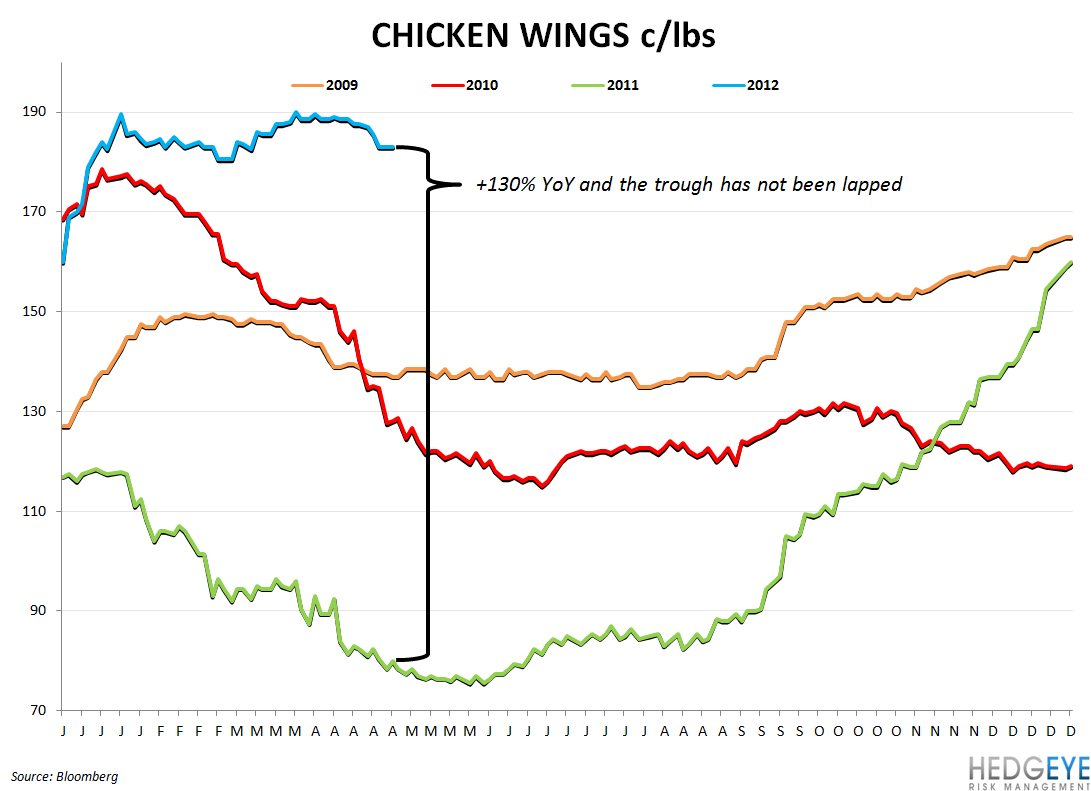
Wing prices were down -1.4% week-over-week but yesterday’s USDA Broiler Hatchery data did not tell us that the supply contraction is coming to an end today or tomorrow. Although prices will peak later this quarter, it is important to realize that the year-over-year impact of wing prices is what matters for BWLD’s EPS. We think the Street is underestimating this impact and overstating FY12 EPS growth by 6-8%. Egg sets for the week ended 4/28 came in at 197k, which implied a slight sequential tick-down in the moving six-week average to ~198k and down 5% versus last year. Egg sets are a leading indicator of supply. Once the upswing comes, it likely will be another two months before supply and price are meaningfully impacted. The chart below illustrates that over the last five years.

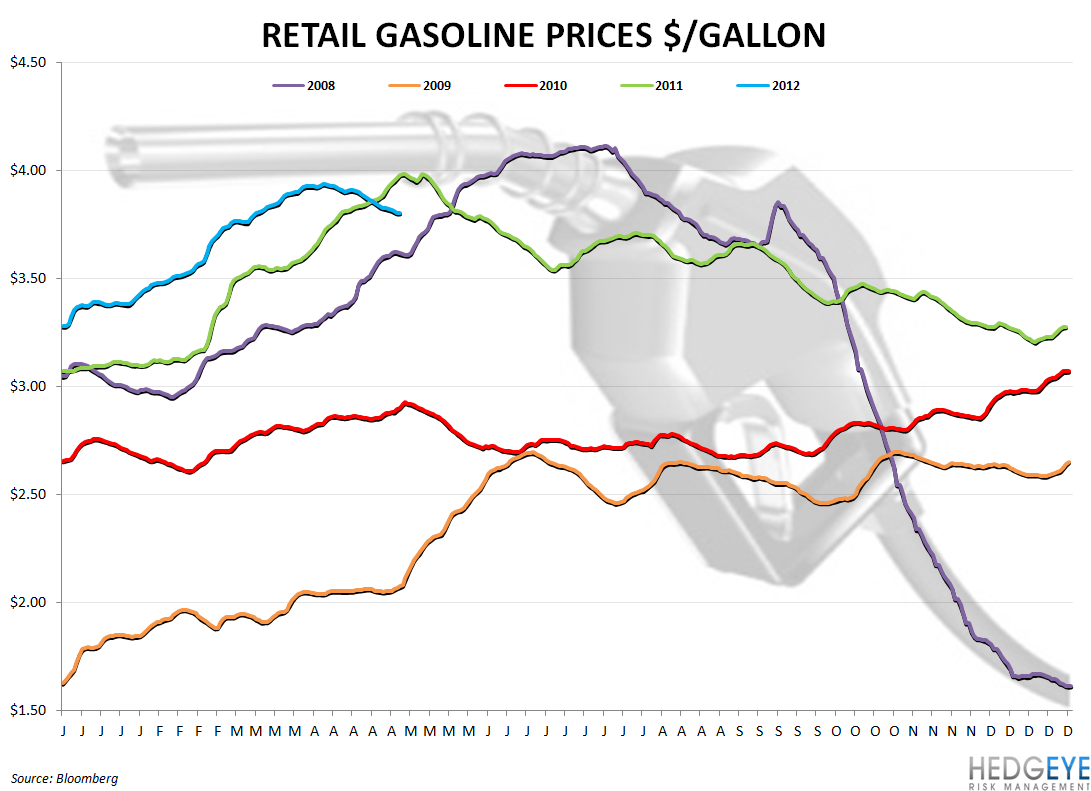
GAS PRICES WATCH
Gas prices declined -4.1% and we would call out (from our correlation table, below) that the 30-day correlation between gas prices and the USD is 0.9. That correlation tends to fluctuate over time.
CORRELATION
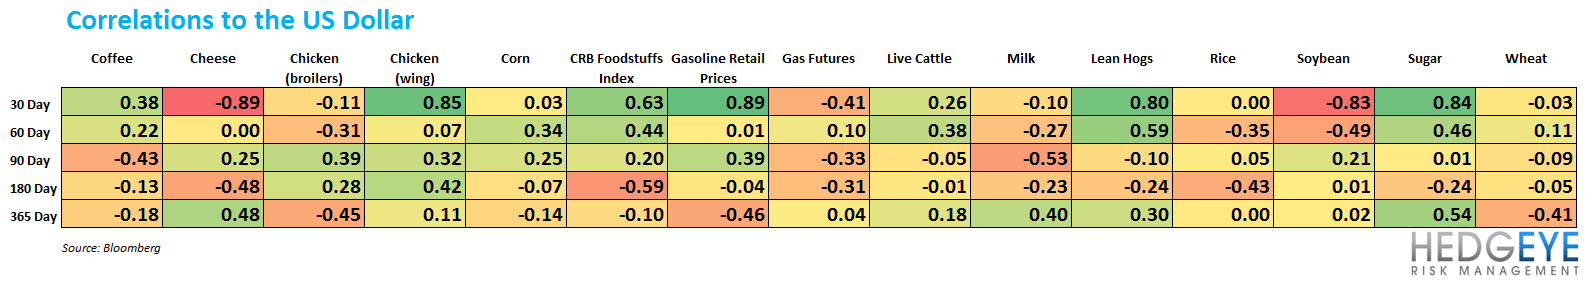
CHARTS


Howard Penney
Managing Director
Rory Green
Analyst
