
“You have to know the past to understand the present”
– Carl Sagan
The main part of the Hedgeye process is knowing where you are on the Sine curve. For me, the best way to do that is to step back and understand past recessions to understand the current recession.
While we do that, the mainstream news is going to do what it does best, which is try its hardest to generate clicks. They are going to try and pull at the masses' heart strings. They are also going to start the blame game because nothing has less answers and is more confusion than two sides pointing the fingers at each other in a he said she said argument.
The first place the media will look is to blame the Fed on over tightening and to beg for a pivot. But here is the thing… no one knows for sure what Powell is going to do. I will also wait for Keith’s signal on this.
Here is what we do know for sure:
- Inflation will remain above the Fed’s target
- GDP will be negative QoQ in Q1 and Q2
- Powell does not want to stop tightening too early like in the 1980s
- The Fed has been relying on the labor market to tell them when to stop tightening
- The market does not bottom when the Fed starts to cut rates
- Bear Stearns was the 5th largest bank when it failed on March 16th 2008, the market bottomed on March 9th 2009
- Silicon Valley Bank was the 18th largest bank when it failed on March 9th 2023
- The 2-10 spread remains inverted at -45 bps

Back to the Global Macro Grind…
This is going to be an extremely busy week with high volatility. In the next week you have: CPI, Retail Sales, PPI, and the next Fed meeting on 3/22.
In this Early Look I’m going to use a lot of pictures because words won’t be able to describe this part of the cycle.
It was just last week (3/8) where the market was implying peak rate hikes. 4 more (25 bps) hikes between now and June with no rate cut until ~January 2024.
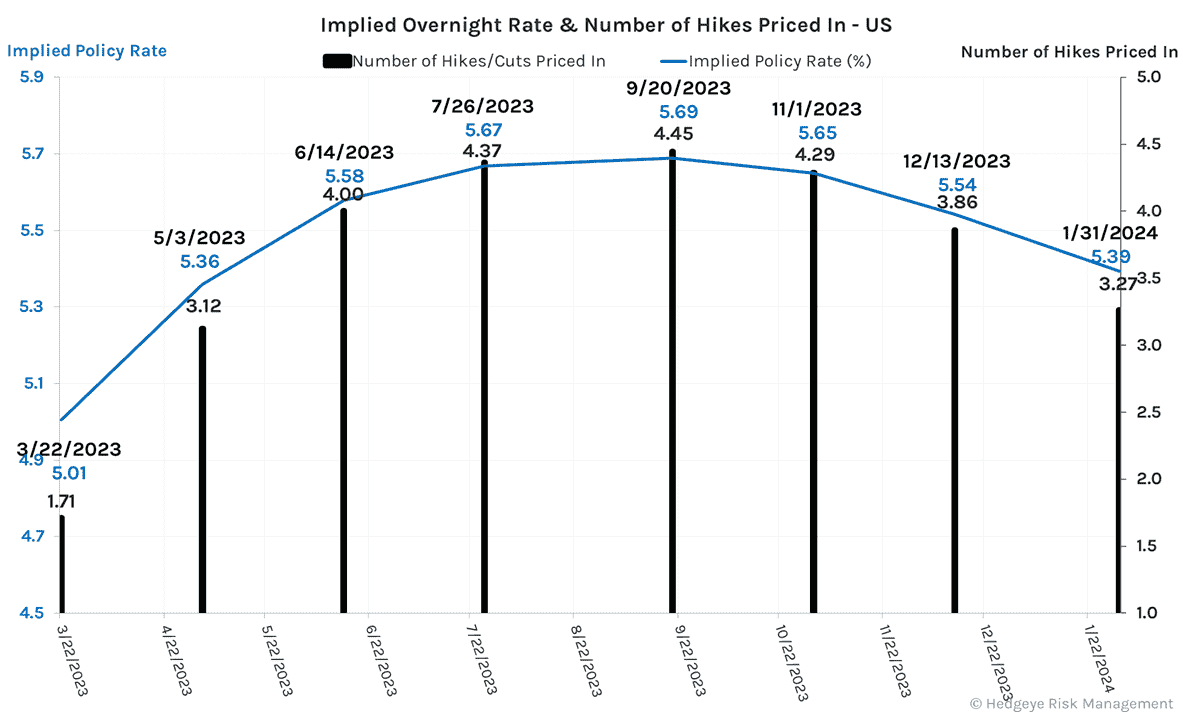
Compare that to today, 1 more hike between now and June with rate cuts in July 2023.

The market is clearly asking for a pivot from the Fed.
We have also seen large daily moves in the 2-10 spread, 2Yr yield, $XLF, $KRE, and Bitcoin. For that let’s look at the last time each of these has moved as much as they have.
The five largest moves in the 2-10 Spread: 10/1/1982 +96 bps, 1/5/1981 +55 bps, 3/13/2023 +48 bps (9.7 Z Score Move), 1/21/1980 +44 bps, and 11/2/1981 +42 bps.
Five largest drops in the 2yr yield: 10/1/1982 -118 bps, 12/19/1980 -84 bps, 1/5/1981 -82 bps, 12/22/1980 -81 bps, 4/16/1980 -75 bps, and the 11th largest move was the most recent 3/13/2023 -61 bps (7.3 Z Score Move).
Five largest drops in the $XLF: 12/1/2008 -16.7%, 1/20/2009 -16.5%, 3/16/2020 -13.7%, 9/29/2008 -13.2%, 4/20/2009 -11.2%, and the 107th largest move was the most recent 3/9/2023 -4.1% (2.2 Z Score Move).
Five Largest drops in the $KRE: 12/1/2008 -16.4%, 3/9/2020 -15.5%, 3/16/2020 -13.7%, 10/9/2008 -13.6%, and 3/13/2023 -12.3% (5.7 Z Score Move)
The most recent move in Bitcoin was the 100th largest move in a single day (a 2.17 Z Score Move) +12.8%.
The first thing that jumps out to me when looking at these moves is that in the 1980s these large moves in the 2yr and 2-10 spread were common.
The second thing is that the $XLF and $KRE had many significant down days like we saw yesterday. There wasn’t just one.
So ultimately the question becomes, is the failure of the 18th largest bank enough for Powell to pivot?
Looking at the next chart it shows the 1980 tightening cycle with the dates highlighted being the largest daily moves in the 2Yr Yield. The first came on 4/16/1980, when Volcker lowered rates the first time, created a mini bull market, then crashed that same market when raising rates again. This is exactly what Powell wants to avoid. The next three dates come at the very beginning of Volcker’s “higher for longer” era. Then finally the 5th largest daily move in the 2Yr came 9 months later at the end of the bear market.

This chart simply overlays the SPX to give context to how the market reacted at each of the moves in the Federal Funds Rate.

Ultimately, when did Volcker begin to pivot for the final time? When he started to see an increase in Jobless Claims. This is where the Volcker era starts to differentiate from today. Initial Jobless Claims peaked at 695k which is the 2nd highest all time (2nd to the pandemic).

For context on today’s jobless claims, it remains near historic lows. Which if you start thinking from Powell’s perspective would mean that his tightening cycle is nowhere near complete. I also included YoY building starts which have historically led jobless claims. If using the ramp in Jobless Claims from the 1980s, it started in ~April 1981 and ended 18 months later in Oct 1982.

The last part I want to introduce is where we stand on valuation. The Hedgeye process never starts or ends on valuation. Its about understanding where we are going. The point of including this chart is that Forward Estimates created by “the street” are based on US GDP accelerating QoQ in Q1. Hedgeye’s nowcast for GDP is for negative QoQ growth in both Q1 and Q2. So how low can Forward P/E go?
Lower than where it is today.

To summarize all this data:
- No one knows for certainty what is going to happen next.
- The market is begging for a Fed pivot.
- The Fed has been very consistent about holding rates higher for longer with labor being its main tool to judge when to pivot.
- Markets don’t bottom when the Fed cuts rates the first time.
- The Market still must show two more quarters of earnings on negative QoQ GDP.
While we don’t know what will happen next, we do know that the collapse of $SIVB is not the end of the story and that the story has much more time to play out.
Immediate-term Risk Range™ Signal with @Hedgeye TREND signal in brackets
UST 30yr Yield 3.61-4.03% (bearish)
UST 10yr Yield 3.52-4.12% (neutral)
UST 2yr Yield 4.01-5.05% (neutral)
High Yield (HYG) 72.41-74.18 (bearish)
SPX 3 (bearish)
NASDAQ 11,029-11,498 (bearish)
RUT 1 (bearish)
Tech (XLK) 132-142 (bearish)
Defense (ITA) 111-118 (bullish)
Shanghai Comp 3 (neutral)
VIX 20.76-28.56 (bullish)
USD 103.15-106.06 (bullish)
EUR/USD 1.050-1.073 (bearish)
USD/YEN 133.04-137.90 (bullish)
GBP/USD 1.177-1.219 (bearish)
Oil (WTI) 72.10-77.69 (bearish)
Gold 1 (bullish)
Copper 3.91-4.14 (neutral)
TSLA 163-194 (bearish)
Bitcoin 19,511-24,693 (bearish)
Ryan Ricci
