“If one does not know to which port one is sailing, no wind is favorable.”
-Seneca
Cassandra was a Trojan priestess of Apollo in Greek mythology. According to the most popular myth, she was admired by the god Apollo, who sought to win her over by giving her the gift of seeing the future. As the story goes, Cassandra promised Apollo her favors, but after receiving the gift, she went back on her word and refused the god. This enraged Apollo. And since he couldn't revoke a divine gift, he added to it the curse nobody would ever believe her prophecies.
In "The Fall of Troy," as told by Quintus Smyrnaeus, Cassandra attempted to warn the Trojan people that Greek warriors were hiding in the Trojan Horse. As the Trojans were feasting and celebrating their victory over the Greeks, Cassandra took an axe in one hand and a burning torch in another and ran towards the Trojan Horse. Her intent was to reveal and destroy the Greek soldiers herself, but the Trojans stopped her.
Most of us know how the story ends. At night, the Greeks snuck out of the Trojan Horse and opened the gates for the waiting Greek army (who had pretended to sail away). Upon entering the city, the Greek forces destroyed Troy and effectively ended the Trojan War.
In modern times, we have adopted the term "Cassandra" as a rhetorical device to indicate when someone whose accurate prophesies are not to be believed. Meanwhile, of course, the more commonly used Trojan Horse is utilized to describe a trick or strategy that causes a target to invite a foe into a seemingly secure place. (Like the stock market?)
In the stock market game, prophesies come fast and furious. If someone has a Twitter account and enough followers, they may have a story about the future that could be believable. Be aware of being ushered into a secure place in which a Trojan Horse may be hiding in your portfolio waiting to do some serious and unexpected damage to your returns.

Back to the Global Macro Grind . . .
Many stock market prophesies start with a view of what happened in the past. A current example relates to the Fed tightening (or a reduction of QE) and the fact that the market often rallied for some extended period afterwards. The challenge with many of these prophecies? They are usually anchored in that person’s current positioning. In other words, we can always find a historical analogy supportive of our positioning.
For example, one could easily look back to the 1970s as a historical analogy. The last time Continuing Claims, from the weekly jobs report, were this low was the end of 1969. In 1970, the Dow Jones Industrial Average opened at 809. A decade later, the DJIA closed at 839 for a gain over the period of ~3.7%. Adjusted for inflation, that return (or lack thereof) was more like ~-49%.
As historically based prophesies go, this one is about as extreme as the ones supporting the idea that stocks always go up – even if growth slows, even if inflation accelerates, and even if valuations are well beyond historical bounds. The truth, of course, is likely to be somewhere in the middle.
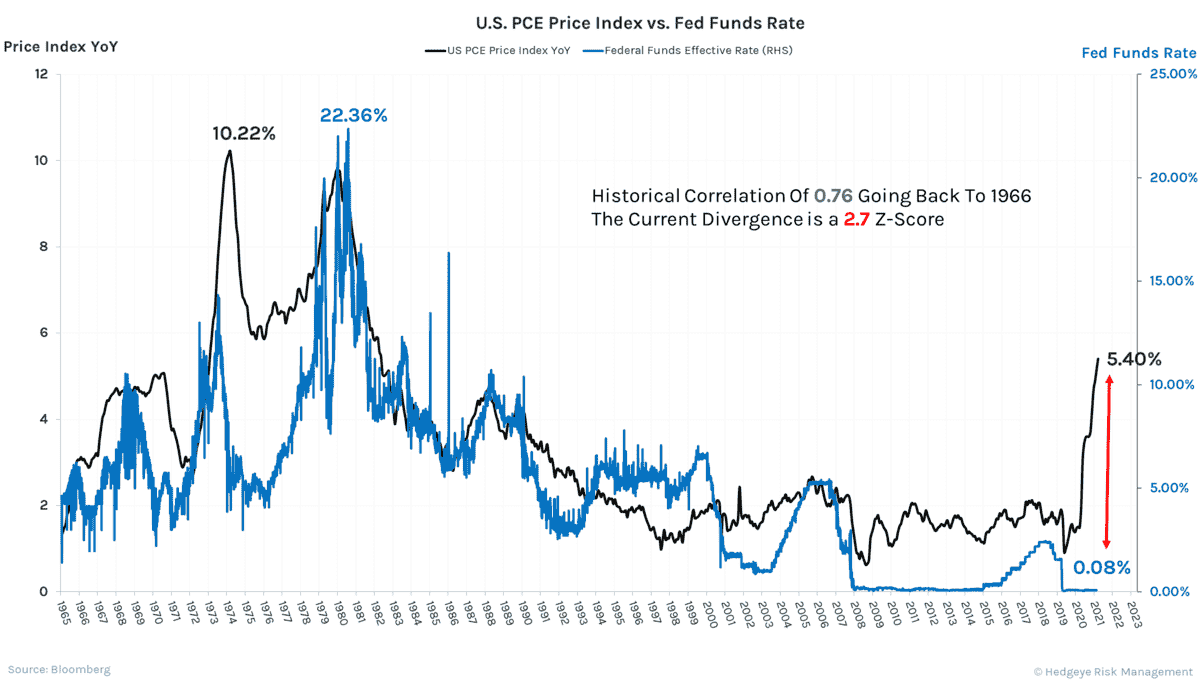
In the Chart of the Day below, we look at the U.S. PCE Price Index versus the Fed Funds Rate going back to 1965. Some of you wise and experienced souls that were investing back in the 1970s may remember those days. And when Fed Fund’s rate peaked at 22.36%, you probably weren’t having a lot of fun as stock market operators. However, the ensuing decades of declining interest rates turned many millionaires into billionaires, particularly people in private equity.
That all said, the most important point of the chart is looking at today and comparing PCE to the Fed Funds Rate.
Currently, Core PCE is at +5.4% Y/Y and the Fed Funds Rate is at ~0.08%. Historically, theses two data series have had a correlation of +0.76, so, no surprise, they are fairly tightly correlated. This current divergence has a Z-Score of 2.7, which has a cumulative probability of 0.3%. In effect, this divergence is right in the very tail of a normal distribution curve.
Even if we all agree that the world is not characterized by normal distributions, this disconnect between interest rates and inflation is still rare when compared to 50+ years of recent economic history. Something is likely to give. Perhaps rates have to go a lot higher? Maybe inflation will start to decelerate? Or (as we believe is more likely), the combination of tightening policy will lead to slower growth and decelerating inflation.
Only time will tell whose “prophesies” are most accurate. In the meantime, be aware of any Trojan Horses lurking in your portfolio. And remember the most important question you can ask yourself every morning: how can you best position your portfolio for the intermediate future? Notwithstanding current positions or existing baggage.
Immediate-term Risk Range™ Signal with @Hedgeye TREND signal in brackets
UST 30yr Yield 2.40-2.60% (bullish)
UST 10yr Yield 2.20-2.49% (bullish)
UST 2yr Yield 2.07-2.52% (bullish)
High Yield (HYG) 80.35-82.88 (bearish)
SPX 4 (bearish)
NASDAQ 13,802-14,702 (bearish)
RUT 1 (bearish)
Tech (XLK) 150-164 (bearish)
Energy (XLE) 74.34-78.62 (bullish)
Gold Miners (GDX) 37.11-40.00(bullish)
Utilities (XLU) 71.37-76.50 (bullish)
Shanghai Comp 3171-3328 (bearish)
Nikkei 27,104-28,392 (bullish)
DAX 14,022-14,795 (bearish)
VIX 17.94-26.06 (bullish)
USD 97.91-99.41 (bullish)
EUR/USD 1.091-1.114 (bearish)
USD/YEN 120.56-124.05 (bullish)
GBP/USD 1.303-1.326 (bearish)
CAD/USD 0.791-0.804 (bullish)
Oil (WTI) 96.02-115.79 (bullish)
Nat Gas 4.73-5.98 (bullish)
Gold 1 (bullish)
Copper 4.58-4.83 (bullish)
Silver 24.30-25.99 (bullish)
Bitcoin 40,375-47,996 (bullish)
Keep your head up and stick on the ice,
Daryl G. Jones
Director of Research