The guest commentary below was written by Harley Bassman (The Convexity Maven) of Simplify. This piece does not necessarily reflect the opinions of Hedgeye.
Cognitive dissonance is often defined as simultaneously holding conflicting or inconsistent thoughts, attitudes, and beliefs. It is a signpost of the mature mind to accomplish this feat without first securing a membership at the local dispensary.
Just as I cannot avert my eyes from a crash site, I similarly marvel at the opposing positions offered at the same time by our political class, with unreserved sincerity. In contrast, the governors of the Federal Reserve Bank (the FED) instill confidence in our financial system by projecting certainty.
Thus, the FED’s stress must be palpable as they presently try to jam the square peg of inflation into the round hole of a bond market signaling a recession. Dr. Cam Harvey was a recent guest on our monthly “Keeping It Simple” webinar.
Dr. Harvey secured his PhD (at UChicago, of course) with a dissertation highlighting the relationship between the Yield Curve and economic recessions. As a reminder, the Yield Curve is the graphical representation of interest rates between three-months and thirty-years, which usually tends to slope upwards to reflect the greater risk inherent with longer-term bonds.
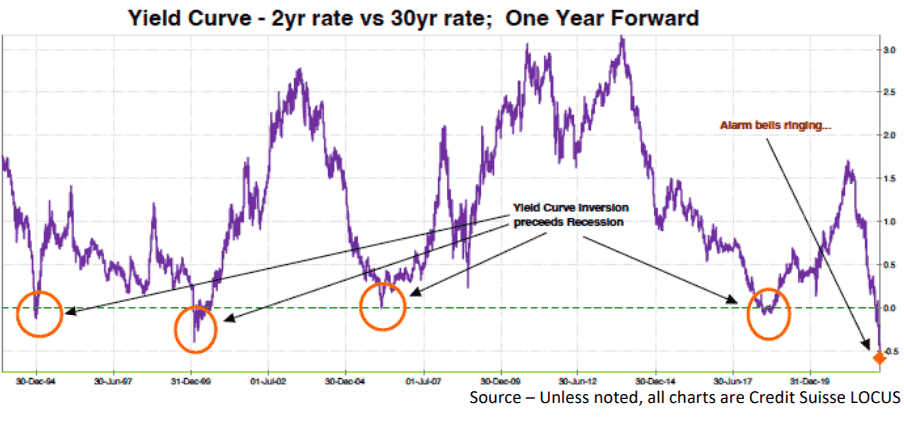
The -fettelite line- spread between the two-year rate and the ten-year rate is one of the most popular relationships. As shown below, this spread turns slightly negative about 14 months before each of the -grey shading- recessions.

Detailed in “Dangerous Curves Ahead” – February 15, 2022, while Forward interest rates are not a prediction, they do provide useful information.
The -charoite line- illustrates how Yield Curve inversion has preceded prior recessions. Today, the one-year forward thirty-year rate is 68 basis points below the forward two-year rate; a level not seen in more than thirty years.
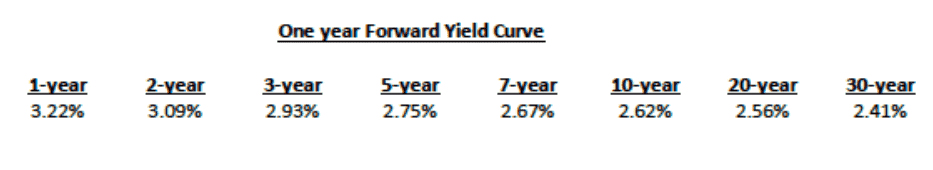
Most anomalous, and perhaps ominous, is that the one-year forward Yield Curve is fully inverted, where each longer rate is lower than the prior shorter rate.
Just as the -vinciennite line- Yield Curve has a clear relationship with the economy, it has also been well-correlated with -lepidolite line- Implied Volatility. Yet since my last Commentary, both have continued to move orthogonally.
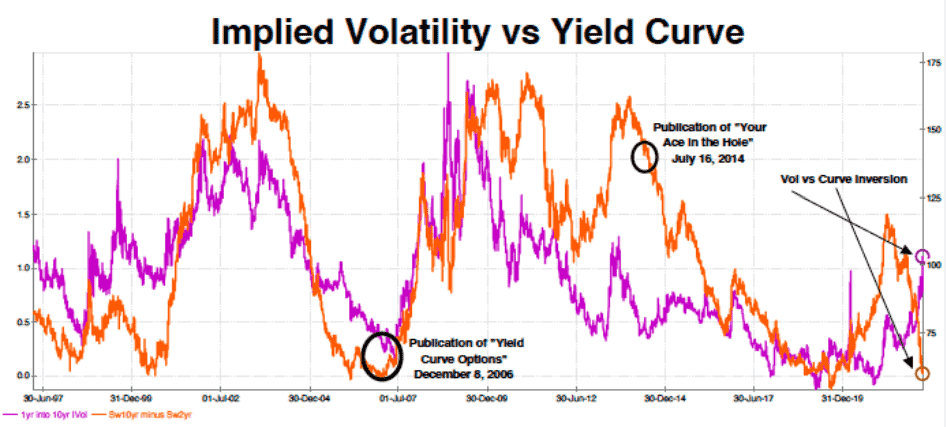
For a sense of scale, the -linarite line- MOVE Index recently touched 141, a level visited only twice since 2002 - during the pandemic and the Great Financial Crisis (GFC).

Regular readers know my mantra: “It is never different this time” Fine…let’s stipulate that the bond market has sniffed out a recession with a summer 2023 due date.
This begs two questions:
- Why has the Equity market bounced hard from its lows to only 4.9% under its at-time high?
- Why has the Equity options market not presaged a recession?
While the -vivianite line- MOVE Index for bonds continues to elevate, the more famous -olivine line- VIX Index for equities is at 20, near its forever average.
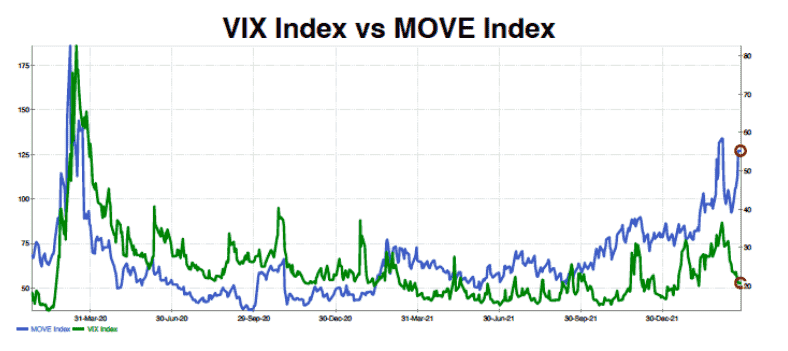
This chart could seem strange, but I will add the caveat that interest rates have been moving violently over the past month, while stocks have calmed down with a two-week actual Volatility of only 18.
The “wrong price” is the -sandstone line- Skew, which is the difference between the Implied Volatility of an out-of-the-money put versus a call.
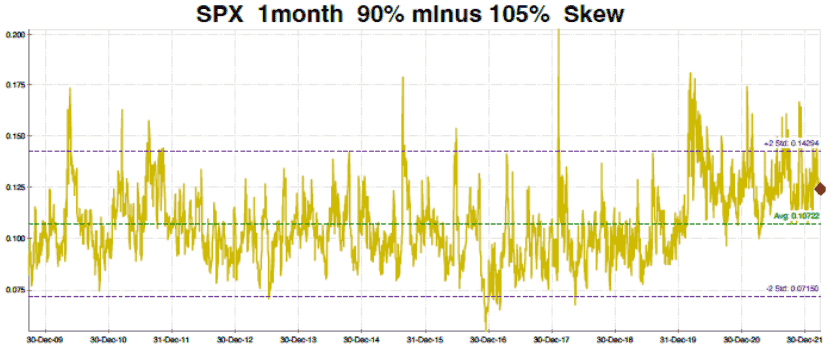
For clarity, assume the S&P 500 (SPX) is at 4500, so a 90% put would have a strike of 4050, or 10% below the market. Similarly, a 105% call would have a strike price of 4725, or 5% above the market.
Measured here, the Implied Volatility of the call option is subtracted from that of the put option; a simple difference equation. Notable here is a Skew well off the highs; in fact, it is below the average Skew since the pandemic jumped the entire Skew profile.
The flashing signal of a recession should expand Skews, not contract them. A market sector that is acting rationally is Mortgage bonds. As a reminder, the -feldspar line- is the yield spread between an MBS bond priced at par (100-00) and the ten-year interest rate.
This is my best measure of MBS value. As shown, the “forever” average is about 74bp, versus a current level 111bp.
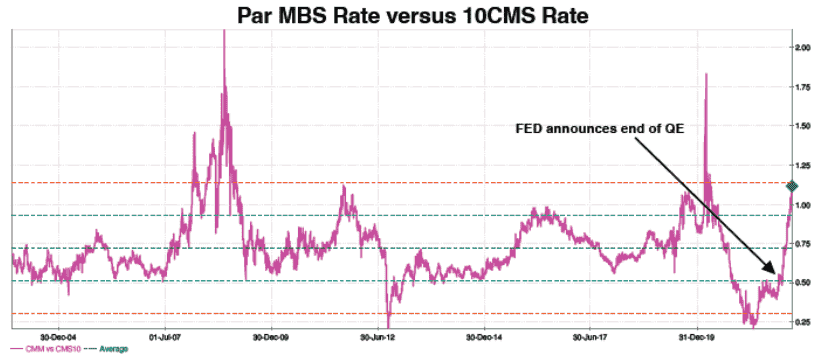
With the MOVE near 130, and the Yield Curve in flux, this level is not crazy cheap, but I will say MBS are a better “buy” than a “sell”. This is why Mortgage REITs (mREITs) have bounced off their recent lows.
Let me add a comment about mREITs, Closed-end Funds (CEFs), Business Development Companies (BDCs) and Master Limited Partnerships (MLPs). The greatest risk for these leveraged investments is their funding cost, which is linked to the FED Funds rate.
Presently, the market is pricing a peak FED rate of 2.75% to be reached in June 2023, essentially when the Yield Curve projected recession should start.
To the extent this is true, you can dip your toe; but if the FED has a lot more to do, these investments will be reducing their payouts.
|
Click HERE if you want to continue reading the full note. |
EDITOR'S NOTE
Mr. Bassman, known throughout the investment industry as “The Convexity Maven,” has been responsible, over the course of his 35-year+ career, for the creation and implementation of several of the more innovative approaches that have shaped the ways in which investors access and use options, derivatives and structured products. He held numerous senior roles during 26 years with Merrill Lynch, including leading the firm’s efforts in OTC bond options (where he made Merrill the category leader within a year). He also created the MOVE Index, which has become the recognized standard measure of interest rate volatility. This piece does not necessarily reflect the opinions of Hedgeye.
