
“Read what you love until you love to read”
- Naval
The headline quote is apropos of nothing beyond the fact that I’ve employed it, with success, as a guiding philosophy with my own kids.
It also generalizes well … sub “work” or “math” (or anything else) for “read” and the potency persists.
It also belongs to the cutesy class of chiral aphorisms that most harbor some real or closet affection for …. “Plan the work then work the plan”, “Failing to plan is planning to fail”, “Those who matter don’t care and those who care don’t matter” … pick your take (then take your pick?!).
Anyway, apparently we’re going to close out Rektember being force fed debt ceiling theatrics, again, fully baked with feigned incredulity and sound bite sensationalism from both sides.
Meanwhile, taxing unrealized gains is somehow still a policy talking point, proposals to establish tracking and reporting guidelines for basically anyone with a bank account is an actual proposal with support, printing a $1T meme coin is still under consideration, conflicted centimillionaire’s are “retiring” quietly into the night while octogenarian’s with no relevant experience or expertise are blindlessly crafting policy around the next gen crypto and tech innovation that will define the growth and social-cultural trajectory and the larger collective future-state, globally and locally, over the next decade.
Oh .. and Natural Gas prices were up 10% (in a day) again yesterday, Sudanese inflation “slowed” to +388%, rising equity-bond correlations are again the scourge of risk parity and pie chart portfolio’s and Brainard’s odds of assuming Fed Chair ramped on PredictIT with Powell becoming a scape goat and/or political bargaining chip.
Admittedly, I’ve been too busy … you know, passionately pursuing (what I think is) actual stuff .. to be hyper focused on any of the above and perhaps there’s some important nuance to it all, but …. WTF is going on?
The future (both individually and collectively) doesn’t just happen to you. You are an active participant in shaping its trajectory. Be the change you want to see, now more than ever.
Back to the Global Macro Grind ….
Part of my recent “stuff” involvement was our 4Q21 Housing themes call, which I delivered alongside my housing/macro partner and (still) your favorite analysts favorite analyst, Josh Steiner.
The below sufficiently captures the crux of the outlook:
THE RESET
Housing activity cooled over the past two quarters as we traversed pandemic amplified comps and as the market digested record high home price growth, a resi construction input cost crescendo, an ongoing, historically tight inventory environment and emerging Quad 3/Stagflationary dynamics. This trajectory was wholly unsurprising as successfully comping the Covid comp was never a reasonable expectation. We dubbed those emerging dynamics our “benign stasis” expectation – that is, activity would decline modestly to reach some lower equilibrium level while carrying little risk for any dramatic cratering.
THE REFLATE
We expect growth to reaccelerate in the 4th quarter domestically as we move past the peak delta variant impact that dented macro activity in August into September. This sets up a reflationary/Quad 2 environment which should see a rebound in hiring and a reacceleration in Services activity, both of which would maintain the (still strong) demand backdrop for Housing. Indeed, the last few weeks have seen housing activity pick up on the demand side. Meanwhile some of the broader structural dynamics remain in place – that is, while all-time tight resale market conditions will constrain the upside in existing sales, it should continue to support elevated HPI while giving the relative advantage to the New Construction Market.
THE RISK
A protracted reflationary/Quad 2 macro regime has not been great for housing historically as both real growth and inflation expectations begin to flow through rates. Typically, curve steeping pushes long-rates higher while expectations for policy tightening get pulled forward, denting the affordability/demand outlook for housing. Similarly, a reemergence and re-intensification in supply chain conditions that further pressures HPI and/or a reacceleration in new construction costs will likely feedback negatively on both the supply & demand sides.
Indeed, on “The Reflate” side, Purchase Apps remained elevated for a 3rd consecutive week yesterday with September tracking at the highest level since April. And Pending Home Sales rose a bigly +8.0% M/M, bringing signed contract activity to the highest level since January and signaling continued solidity for closed transaction volume.
The full deck was north of 100 pages and replete with nuance. If you are a current or interested Institutional or Macro Pro sub and would like access to the replay, please contact
Across a separate, orthogonal dimension of my “stuff”-averse sits crypto and the broader digital asset space, where I’ve been teasing the inclusion of on-chain analytics for a while now.
I’ll begin including a selection of the data next week and we’ll more fully incorporate it in a larger remix/evolution of the product in the following weeks.
First, simply remember why on chain data is great. It’s great because its on-chain … which means it’s public, immutable and transparent for anyone to see.
The capacity to forensically analyze every transaction and distill out to meaningful conclusions and/or helpful context is still an open frontier in evolution.
Let’s take it for a quick test drive here this morning using BTC as our case study:
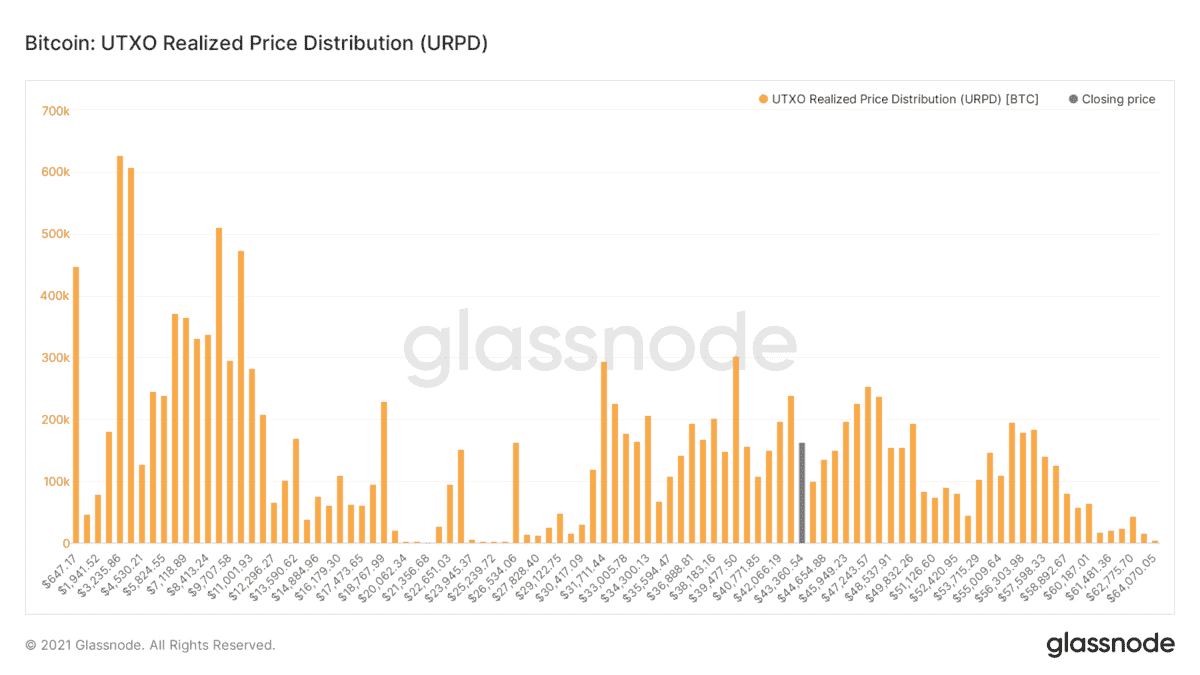
1. UPRD | Coin distribution by price: The UTXO Realized Price Distribution (URPD) shows at which prices the current set of Bitcoin UTXOs were created, i.e. each bar shows the amount of existing bitcoins that last moved within that specified price bucket. Knowing where support clusters and potential price vacuums sit is of obvious interest.
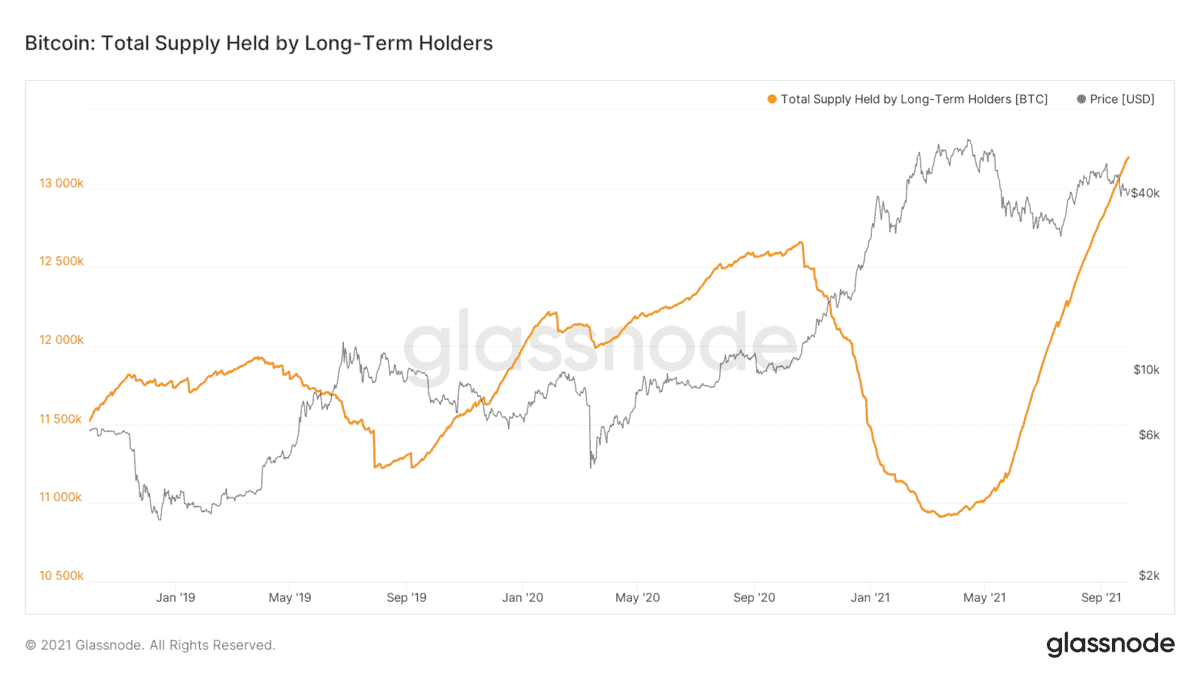
2. Hodlers | Now, Who Owns those Coins? The total amount of circulating supply held by long term holders (>155 days). Long-term hodlers continue to accumulate coins, absorbing ~2.5M coins (more than 10% of circulating supply) since the May swoon.
3. SOPR | What Are They Doing With Those Coins? SOPR (Spent Output Profit Ratio) reflects the degree of realized profit for all coins moved on-chain. Long Term Holder SOPR (LTH-SOPR) is SOPR that takes into account only spent outputs with a lifespan of at least 155 days and serves as an indicator to assess the behavior of long term investors. This dipped negative over the last few days for the first time YTD. Given that the spring buyers had the highest cost basis and only recently moved into the LTH bucket, SOPR going negative suggests it’s the newest (and weakest) hands selling while the longer-term holders continue to accumulate.

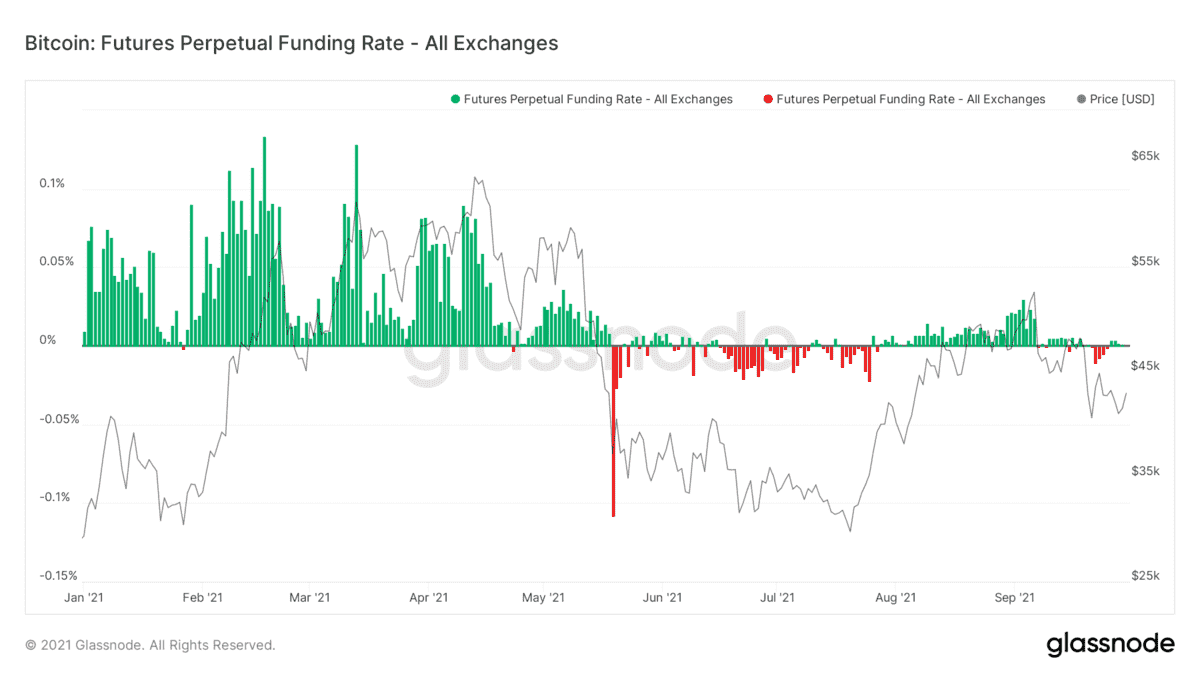
4. Sentiment | Perpetual Futures Funding Rates: The average funding rate (in %) set by exchanges for perpetual futures contracts. When the rate is positive, long positions periodically pay short positions. Conversely, when the rate is negative, short positions periodically pay long positions. A classic overbullish sign is when open interest spikes, skew shifts positive and funding rates become increasingly elevated … which is a combustible mix and an invariable part of the tinder box that propagates liquidation events, selling cascades and 20% drawdowns (in minutes) when conditions reverse.
So, with a pedestrian stroll across that small metric set we were able to roughly identify support/resistance/price vacuum levels, who owns at those levels, what class of holders are capitulating or not, whether different investor classes are aligned or divergent in their positioning and whether sentiment is benign, bullish or in Full on FOMO mode.
There exists a growing repository of hundreds of metrics which carry either daily or situational relevance.
Another great part of the crypto evolution is that it allows macro-philes to study macro cycles playing out in hyper-speed in the wild. Crypto adoption is occurring faster than any other technology innovation in history and the rapidity at which intra-sector dynamics and cycles (NFTs, for example) are playing out is dizzying.
As always, macro never promises certainty, but it does promise “not boring”
GM, WGMI…
Immediate-term Risk Range™ Signal with @Hedgeye TREND signal in brackets:
UST 10yr Yield 1.36-1.60% (bullish)
UST 2yr Yield 0.23-0.34% (bullish)
SPX 4 (bullish)
RUT 2191-2294 (bullish)
NASDAQ 14,422-15,341 (bullish)
REITS (XLRE) 44.60-47.32 (bullish)
Tech (XLK) 149.04-158.53 (bullish)
Utilities (XLU) 63.07-66.58 (bearish)
Energy (XLE) 48.50-54.77 (bullish)
Financials (XLF) 37.05-39.33 (bullish)
Shanghai Comp 3 (bearish)
Nikkei 29,332-30,806 (bullish)
DAX 15,124-15,838 (bullish)
VIX 15.42-25.51 (bearish)
EUR/USD 1.555-1.183 (neutral)
Oil (WTI) 71.32-76.93 (bullish)
Nat Gas 4.90-6.06 (bullish)
Gold 1 (bearish)
Copper 4.09-4.38 (neutral)
Have a great day out there,
Christian B. Drake
Macro analyst
