
NewsWire: 3/22/21
- According to the latest CBO projections, the federal debt will double to 202% of GDP by 2051. Underlying this gloomy fiscal news is an aging and slower-growing economy in which net immigration will comprise all additions to the population past the year 2043. (Congressional Budget Office)
- NH: The CBO ordinarily releases its annual 30-year budget outlook in the spring or summer. But such was the mood of vertiginous uncertainty early last year that the CBO waited until September to release its 2020 report.
- That report was a shocker--but not, as it turned out, due to the sudden emergence of the Covid-19 lockdown (which was not expected, and is still not expected, to have a large direct impact on long-term economic trends).
- The surprise, rather, was the significant slowdown in CBO's projected long-term real GDP growth for reasons unrelated to Covid-19. The most important of these reasons were lower long-term assumptions about workforce growth and (to a lesser extent) labor productivity growth through the year 2050. Add this lower GDP projection to the one-time wallop of much-larger federal deficits over the next few years (this was due to Covid-19) and, well, we got to look at some new and pretty scary federal debt projections.
- See my two-part breakdown of that report: the first part covering the economic forecast ("CBO Projects Long-Term Slowing of US GDP Growth Rate") and the second covering the fiscal forecast ("The Fiscal Side of the CBO Long-Term Forecast"). If you're wondering how the CBO calculates these forecasts or how all the pieces fit together, these NWs may answer many of your questions.
- OK, so what do I make of the CBO's just-released 2021 report? I'm going to do the same thing this year as I did last year. I will divide my discussion into two parts. In this NW, I'll discuss the CBO's economic and demographic outlook. In my next NW, I'll take on the CBO's fiscal outlook.
- Let's plunge in.
- The economic bottom line is real GDP. And overall this year's long-term real GDP projection has not changed much at all. Compared to last year's projection, GDP will grow faster in 2020, a bit slower in the late 2020s, and as before stabilize thereafter--at +1.6% after 2027 and at +1.5% from 2038 through 2050. Projected annual real GDP in 2050 is almost identical to what it was last year.
- On productivity, again, little change. Total factor productivity (TFP) growth, after getting downshifted again last year, has an unchanged path this year. Despite somewhat weaker national savings and investment rates (thanks to more federal crowding out), cumulative labor productivity (real GDP per hour worked) actually rises slightly (<1%) by 2050 over last year's projection. Apparently, the negative impact of less capital per worker hour was wiped out a less-severe estimate of the path effects of the recession of 2020
- The CBO's productivity prognosis, then, remains more or less unchanged. Taking "potential" numbers and ignoring the business cycle, labor productivity is expected to grow by nearly +1.3% yearly from 2020 to 2051, which is a bit higher than the +1.2% yearly from 2008 to 2020.
- That's still low of course by comparison to most of postwar history. But it's not nearly as disappointing as the expected decline in the growth rate in worker hours. In fact, worker hours are expected to grow more slowly by far than in any earlier era of American history. This is the most important reason why the rate of real GDP growth is lower than it used to be.
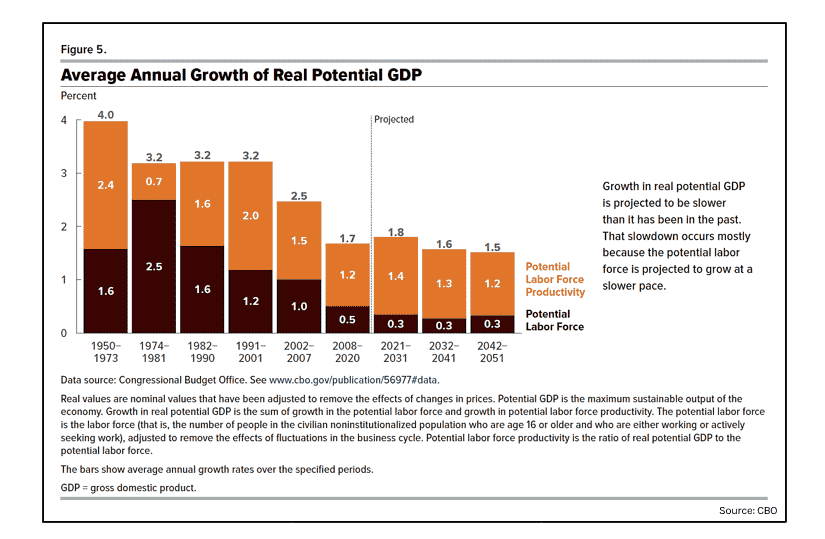
- Here, "labor force productivity" means the combined contribution of TFP and capital accumulation. "Labor force," on the other hand, essentially means worker hours. The labor force growth rate reflects the growth rate of the working-age population (age 20-65), which will sink to its all-time low point, very close to zero (< +0.1%), around 2025. That will be the high-tide of late-wave Boomers celebrating their 65th birthday.
- The labor force growth rate would today already be negative, of course, were it not for net immigration, which adds roughly +0.4% each year to the working-age population.
- And just as immigrants today keep the labor force growing, in about 20 years--once Boomers begin to pass away in large numbers--immigrants will keep the entire US population growing. Starting in 2044, CBO projects that natural population increase (births minus deaths) will turn negative. Without net immigration, our population would then start shrinking.
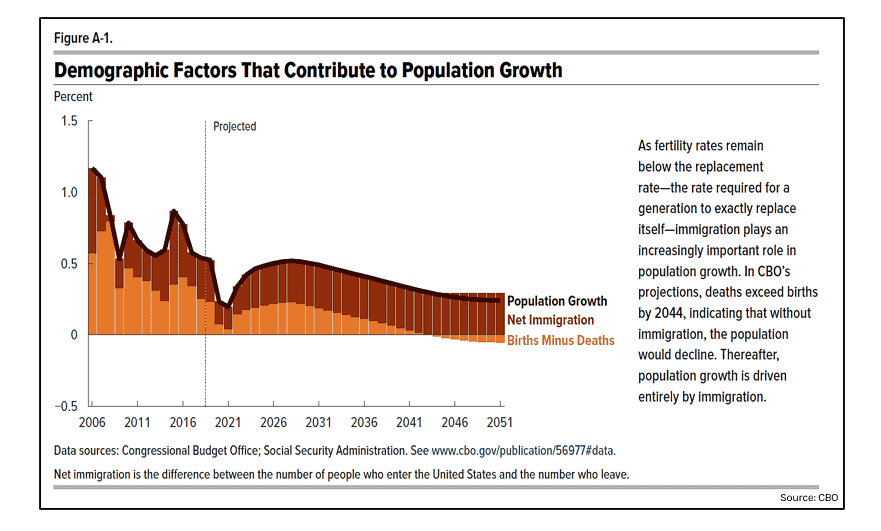
- The Covid-19 pandemic has given us an interesting preview of what's to come. Take another look at the last chart. In 2020 and 2021, deaths rose and both births and net immigration fell. The numbers reflected in this chart, which are CBO's early estimates, show natural increase almost hitting zero in 2021. The final data may yet indicate one or two years of momentary negative growth in the US population. (See "US Population Growth Slows Almost to a Halt.")
- OK, let's move on to talk more broadly about demographic and labor market behavior. Here's where the 2021 CBO outlook gets more interesting.
- The CBO chose this year to ratchet down (once again) its future total fertility rate (TFR) assumptions--from 1.90 by the late 2020s and beyond to 1.85. With mortality and net immigration assumptions unchanged, this has a growing and cumulative impact on population size as time goes on. By 2050, the US population will be smaller by 4 million people (that is, smaller by -1.1%) than the CBO projected last year.
- Fewer births ought to have a significant negative impact on workforce size by the 2040s. The CBO has effectively sterilized this impact, however, by another positive shift. CBO economists this year ramped up their assumptions about future labor force participation (LFP) rates. Specifically, they assumed that the average LFP rate would stabilize around 60.1% or 60.2% after the late 2030s--higher than the 59.6% they assumed last year. This has the effect of boosting effective employment and real GDP by +0.8% in the out years. And it wipes out the negative impact of fewer births and a slightly higher long-term unemployment norm.
- What's behind the CBO's higher projected LFP rates? It's not clear. The CBO only acknowledges in its report that it "raised its projections of the labor force participation rate over the medium term and long term after reassessing the historical trends in participation among various demographic groups."
- By "demographic groups" CBO means age groups. Apparently, CBO has seen fit to raise gradually the LFP rates of nearly every age bracket over 25 throughout the projection period--and to raise the LFP rates of the oldest age brackets (55+) the fastest.
- LFP rates are typically highest for people in their late-30s to late-40s (they peak at about 91% for men in their late-30s and at about 76% for women in their late-40s). At older ages, LFP rates decline. And past age 65, they decline steeply. Every year, as our society ages, the distribution of the 16+ population gradually shifts into the older age brackets. Therefore, even if the LFP rate in every age bracket were fixed, aging would inevitably cause the average LFP rate of the entire population to decline over time.
- This declining trend persists in the new CBO projection. In 2019 the average LFP was 63.1%. This year the CBO projects it to be 60.1% by 2050. But my point is that the CBO's new assumptions, especially those that steeply ramp up the oldest LFP rates, appreciably moderate the pace of that decline.
- To visualize the magnitude of these LFP rate changes, let's take a look at the CBO's LFP rates by age as a percentage of what they were at the peak of the last business cycle (an average of 2017 to 2019).

- As we can see, the CBO is assuming a modest rise in the LFP of all ages under 50 and progressively steeper rises over age 50. What's surprising is how steep these rises are. No doubt the CBO has always been assuming a ramp up, but just the further tilting up of this projection over the past year gives the US economy nearly another one percentage point of real growth over thirty years.
- No doubt the CBO would argue that these assumptions are reasonable because older workers have indeed experienced impressive LFP growth over the past twenty years as Boomers have aged into this phase of life. Fine. We've written often about this. (See "Retirement-Age Workers Giving the World a Boost.") But is it prudent to assume this generational trend will go on indefinitely in the same direction?
- I should point out that the secular trend in young and prime-age males has been emphatically in the other direction--toward steadily lower LFP rates at every business cycle peak. We've written about this as well. (See "Why Americans Are Working Less.") Yet the CBO projects little or no decline for these younger males and an accelerated rise for younger females. (Keep in mind that I'm comparing these future LFP rates to the peak of the most recent business expansion.)
- You can't help but feel that the CBO is nudging these assumptions in an optimistic direction: accepting past trends when they're favorable, rejecting them when they're not. We notice this inertial optimism BTW in many of CBO's assumptions.
- Why, for example, is TFP expected to grow faster during 2021-2051 (+1.1% per year) than it did during 2008-2021 (+0.8% per year)? Instead it is reverting back to the +1.1% average of an earlier period, 1. Why ignore this negative post-GFC news entirely?
- Or another example. Why expect the TFR to rise again and flatten out at 1.85 when US fertility last crossed that rate in 2014 on its ways down and has been declining ever since? In 2019, at the peak of the last business expansion, US TFR was 1.71. In 2021, IMO, we're looking at something in the neighborhood of 1.55 (though again the CBO optimistically projects 1.61 for this year).
- I don't want to sound like a killjoy here. But prudent assumptions about these two fundamental variables--innovation and fertility--are a critical first step to thinking realistically about our long-term future economic trajectory. Next up I'll be discussing the CBO's fiscal projections, where over-optimism poses an even greater temptation.
- Tomorrow: The Fiscal Side of the CBO Long-Term Forecast.
| To view and search all NewsWires, reports, videos, and podcasts, visit Demography World. For help making full use of our archives, see this short tutorial. |
