This note was originally published August 28, 2014 at 12:01 in Financials. Click here for more information about our services.
Investment Company Institute Mutual Fund Data and ETF Money Flow:
In the most recent 5 day period ending August 20th, equity fund flow trends rebounded marginally with domestic stock funds breaking a 16 week running outflow. However intermediate term trends are still intact with aggregate fixed income netting $4.9 billion in net new flow in the most recent five day period, nearly a 2-1 ratio versus the $2.6 billion allocated to equities. Defensive positioning by the investment community continues with taxable bonds having inflow in 26 of the past 28 weeks. Domestic stock funds conversely have had outflow in 16 of 17 weeks and continue to be mired in the seasonally weakest part of the year. We recommend that investors avoid Janus Capital (JNS) and T Rowe Price (TROW) during this time and into 2015 based on this challenging industry data.
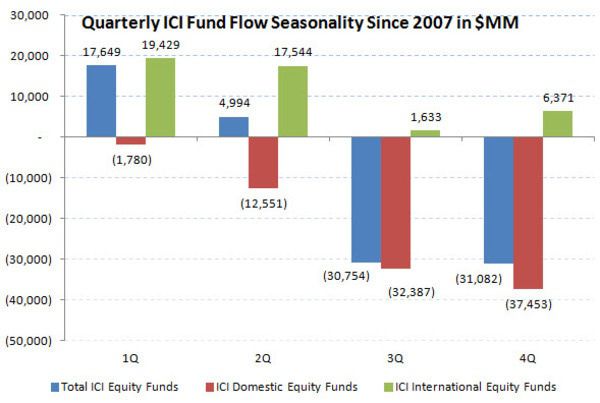
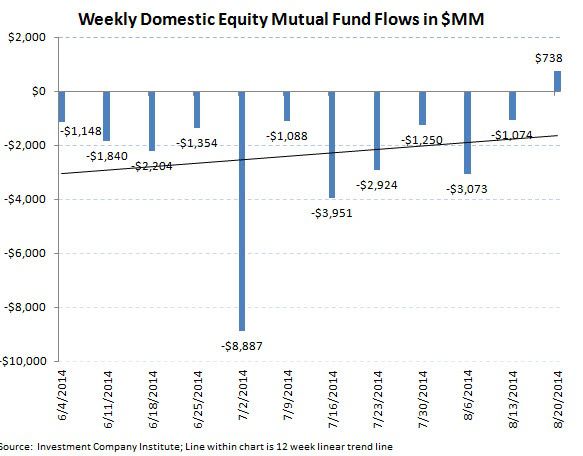
Total equity mutual funds had inflow in the most recent 5 day period ending August 20th with $2.6 billion coming into all stock funds as reported by the Investment Company Institute. The composition of the inflow continued to be weighted towards International stock funds with $1.9 billion coming into foreign funds making it a perfect 33 for 33, i.e. inflows in every week of 2014 for the category. While domestic stock funds last week had a marginal $738 million subscription and snapped 16 consecutive weeks of redemption, over $40 billion has been redeemed from U.S. stock funds over the past 4 months. We don't categorize a drawdown sequence as having been broken until there are 4 consecutive weeks of inflow and thus we are still looking for weak domestic fund trends for the rest of the year, especially entering the seasonally weak fourth quarter. The running year-to-date weekly average for equity fund flow is now a $1.5 billion inflow, which is now well below the $3.0 billion weekly average inflow from 2013.
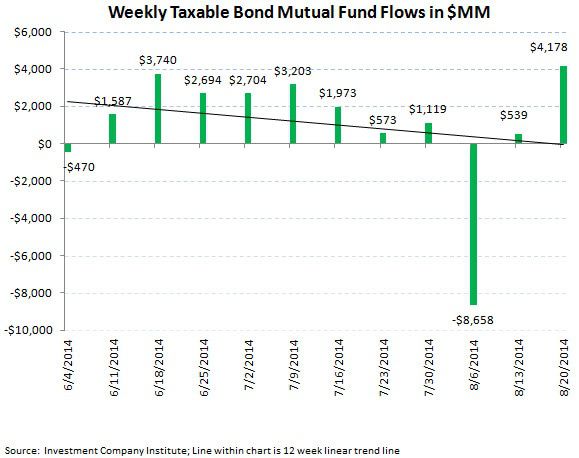
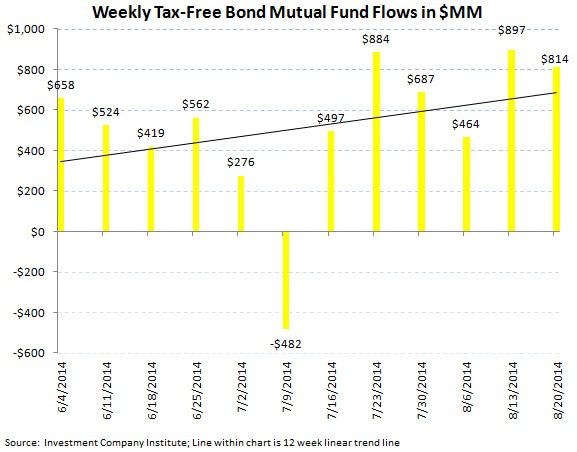
Fixed income mutual funds had another positive week of production with $4.9 billion coming into the asset class. The inflow into taxable products of $4.1 billion made it 26 of 28 weeks with positive flow. Municipal or tax-free bond funds put up a $814 million inflow, making it 31 of 32 weeks with positive subscriptions. The 2014 weekly average for fixed income mutual funds now stands at a $1.9 billion weekly inflow, an improvement from 2013's weekly average outflow of $1.5 billion, but still a far cry from the $5.8 billion weekly average inflow from 2012 (our view of the blow off top in bond fund inflow).
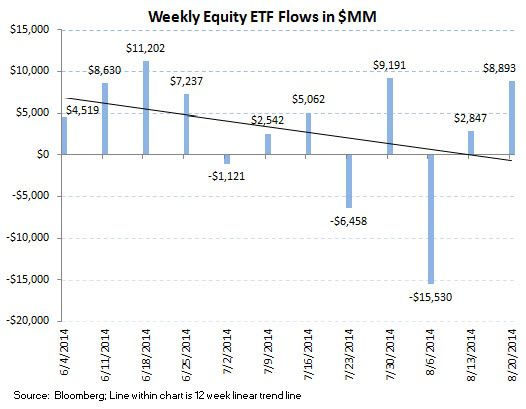
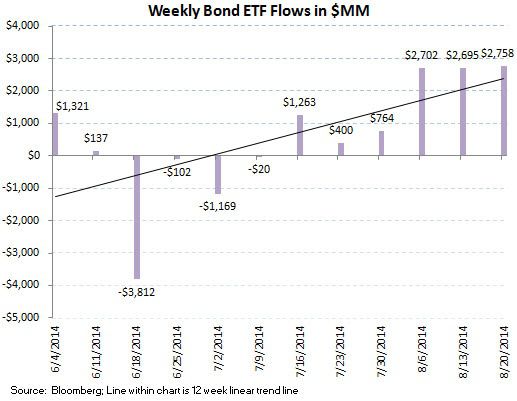
ETF results were broadly positive during the week with inflows into both equity funds and fixed income products. Equity ETFs put up a $8.8 billion subscription while fixed income ETFs put up a $2.7 billion inflow. The 2014 weekly averages are now a $1.5 billion weekly inflow for equity ETFs and a $995 million weekly inflow for fixed income ETFs.
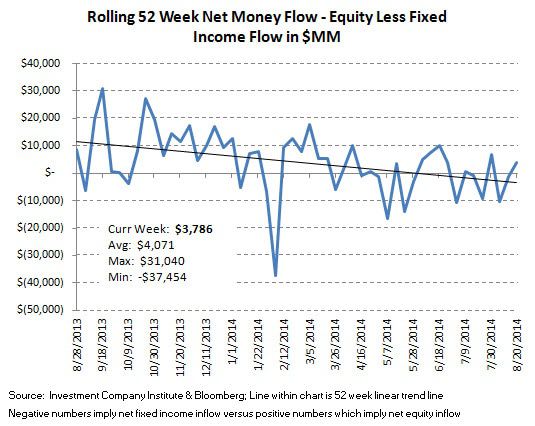
The net of total equity mutual fund and ETF trends against total bond mutual fund and ETF flows totaled a positive $3.7 billion spread for the week ($11.5 billion of total equity inflow versus the $7.7 billion inflow within fixed income; positive numbers imply greater money flow to stocks; negative numbers imply greater money flow to bonds). The 52 week moving average has been $4.0 billion (more positive money flow to equities), with a 52 week high of $31.0 billion (more positive money flow to equities) and a 52 week low of -$37.5 billion (negative numbers imply more positive money flow to bonds for the week). The 52 week moving average chart displays the declining demand for all equity products (funds and ETFs) for the safety and security of fixed income.
Mutual fund flow data is collected weekly from the Investment Company Institute (ICI) and represents a survey of 95% of the investment management industry's mutual fund assets. Mutual fund data largely reflects the actions of retail investors. Exchange traded fund (ETF) information is extracted from Bloomberg and is matched to the same weekly reporting schedule as the ICI mutual fund data. According to industry leader Blackrock (BLK), U.S. ETF participation is 60% institutional investors and 40% retail investors.


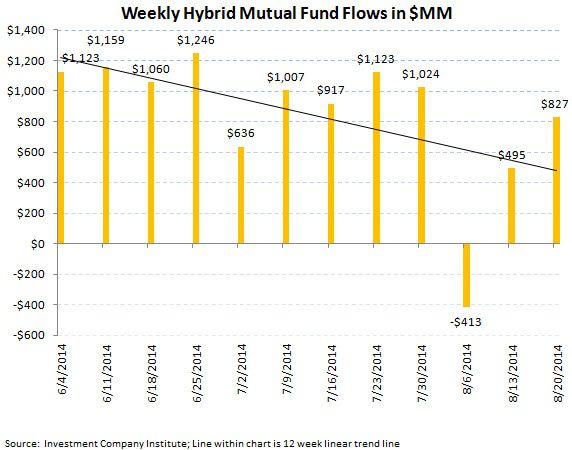
Most Recent 12 Week Flow in Millions by Mutual Fund Product:

Most Recent 12 Week Flow Within Equity and Fixed Income Exchange Traded Funds:
Net Results:
The net of total equity mutual fund and ETF trends against total bond mutual fund and ETF flows totaled a positive $3.7 billion spread for the week ($11.5 billion of total equity inflow versus the $7.7 billion inflow within fixed income; positive numbers imply greater money flow to stocks; negative numbers imply greater money flow to bonds). The 52 week moving average has been $4.0 billion (more positive money flow to equities), with a 52 week high of $31.0 billion (more positive money flow to equities) and a 52 week low of -$37.5 billion (negative numbers imply more positive money flow to bonds for the week). The 52 week moving average chart displays the declining demand for all equity products (funds and ETFs) for the safety and security of fixed income.
Jonathan Casteleyn, CFA, CMT
203-562-6500
Joshua Steiner, CFA
203-562-6500
