This note was originally published November 15, 2012 at 09:48 in Financials
Hurricane Comparisons
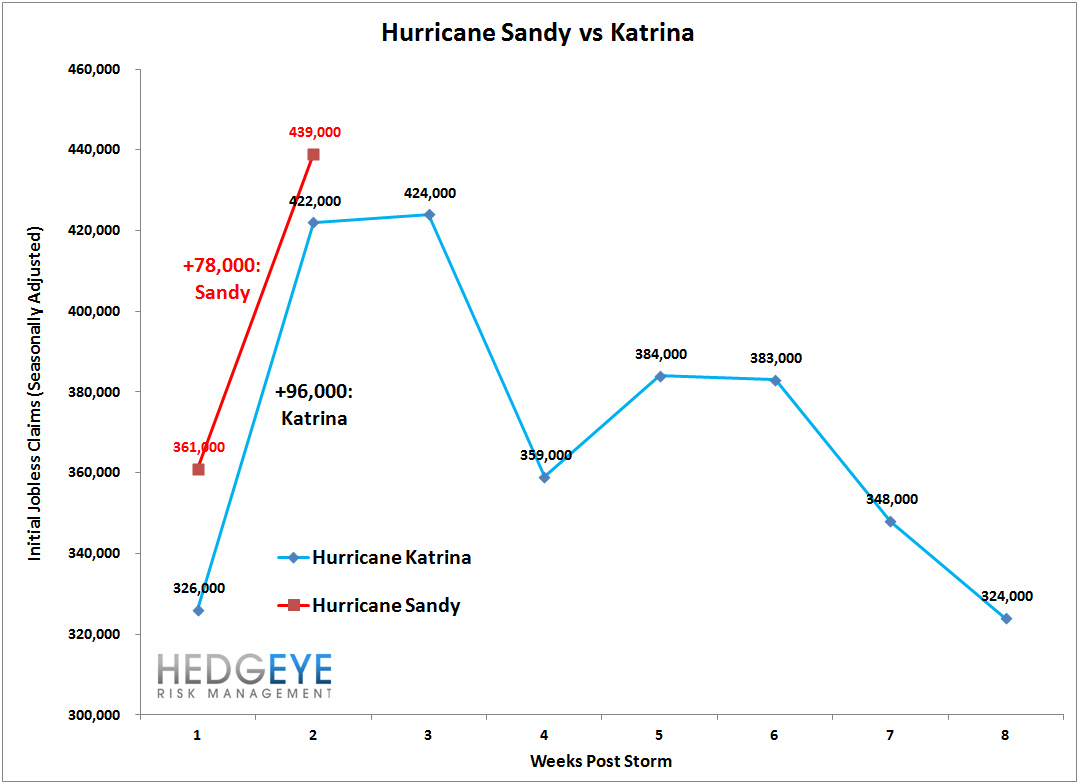
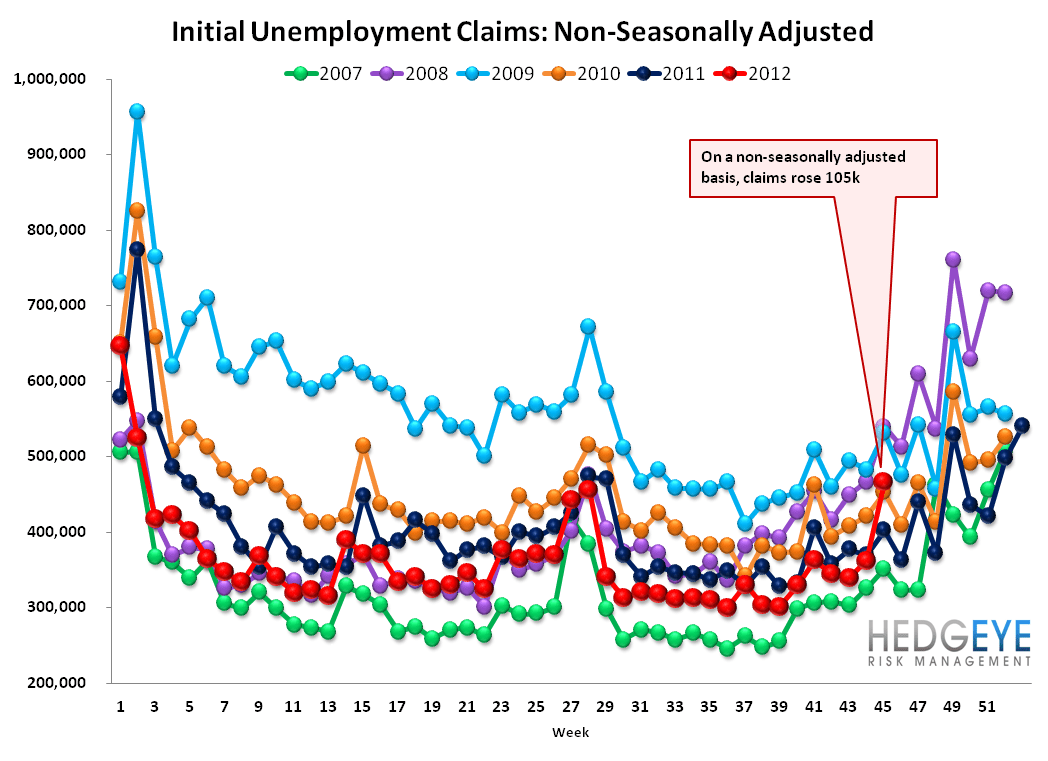
Remain calm. In the chart below we profile the trend in initial jobless claims following hurricanes Katrina and Sandy. If, in fact, this week's enormous surge in initial claims is attributable to Sandy, then we can reasonably expect to see it mean revert along a similar path that we saw following Katrina. That said, it took 8 weeks for Katrina to fully renormalize.
There is in fact a way in which we can test the government claim that the rise in claims is attributable to Sandy. The government releases state-level NSA claims. Total NSA claims rose 104k WoW. We would expect to see a preponderance of that increase represented by New Jersey, New York and other hard-hit East coast states. Unfortunately, the state level data is not yet available on the Labor Dept website. Stay tuned.
Initial Jobless Claims: The Data
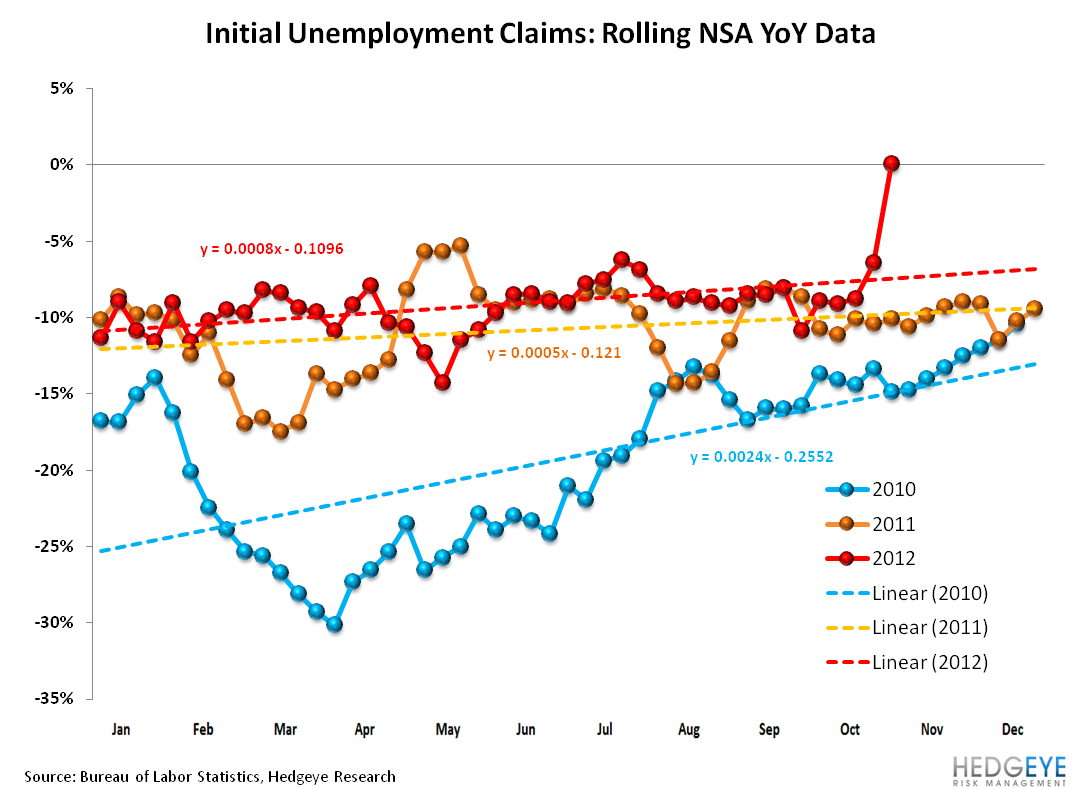
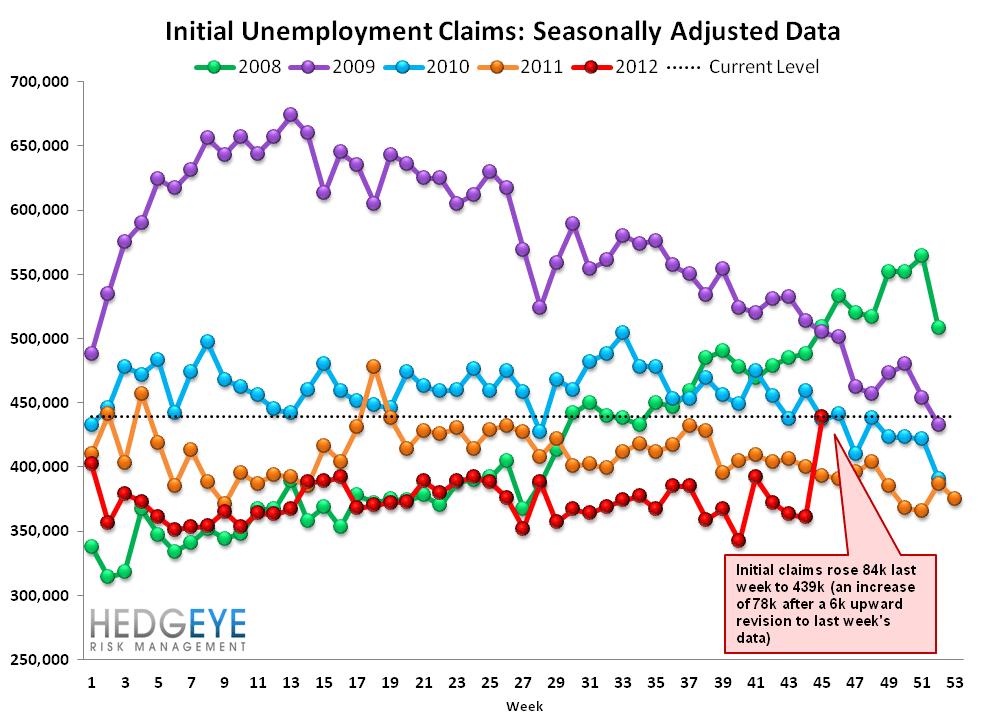
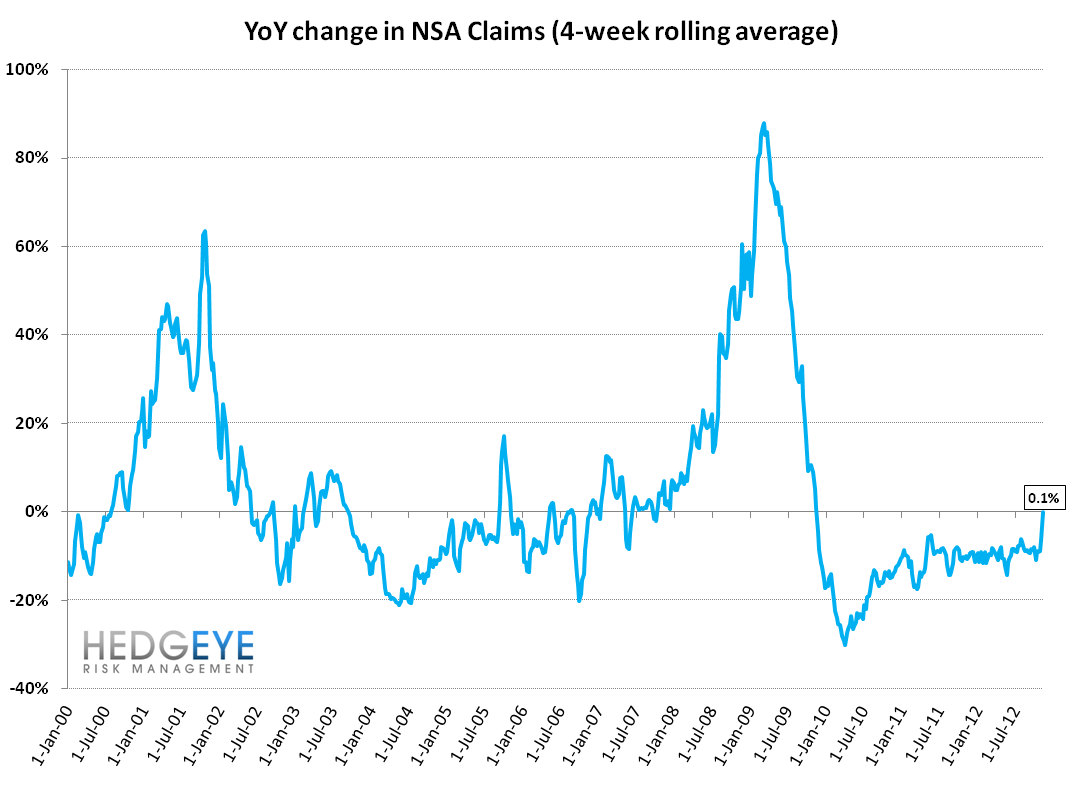
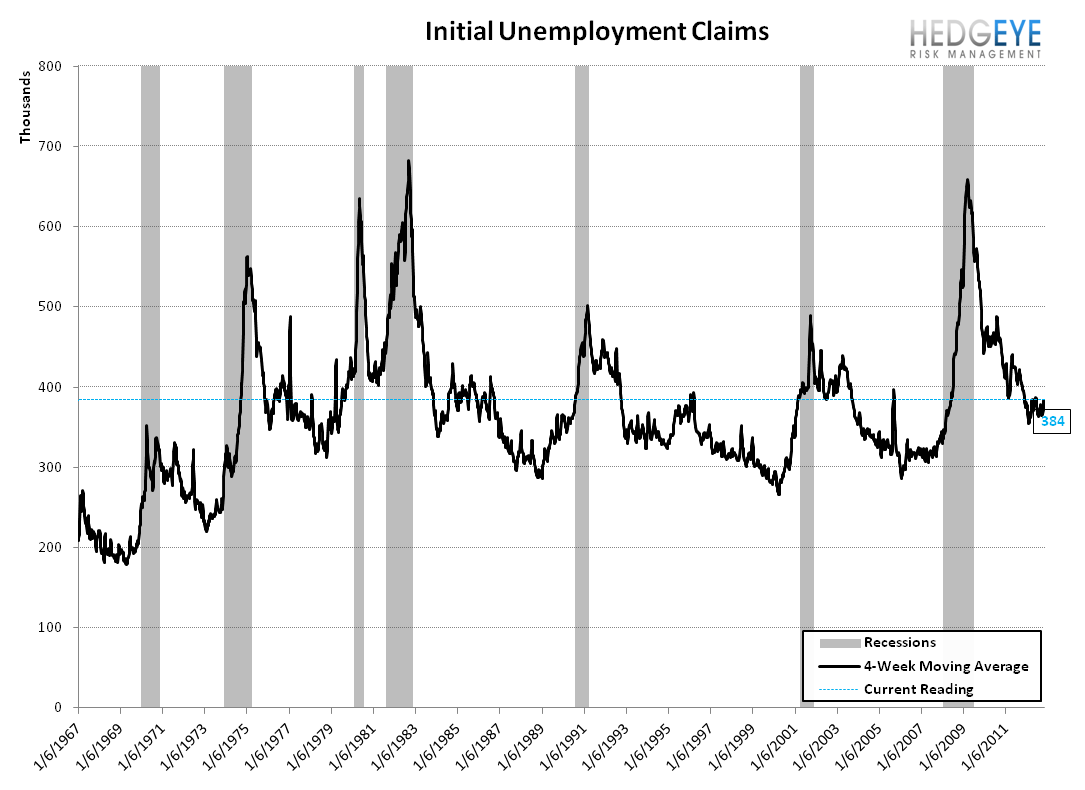
Initial claims rose 84k last week to 439k (an increase of 78k after a 6k upward revision to last week's data). The rolling claims series rose 11.75k WoW to 384k. On a non-seasonally adjusted basis claims rose 104k to 466k. The year-over-year rolling NSA change made a dramatic jump to ~0% improvement. Last week the YoY rolling NSA change was -6.5%.


Yield Spreads
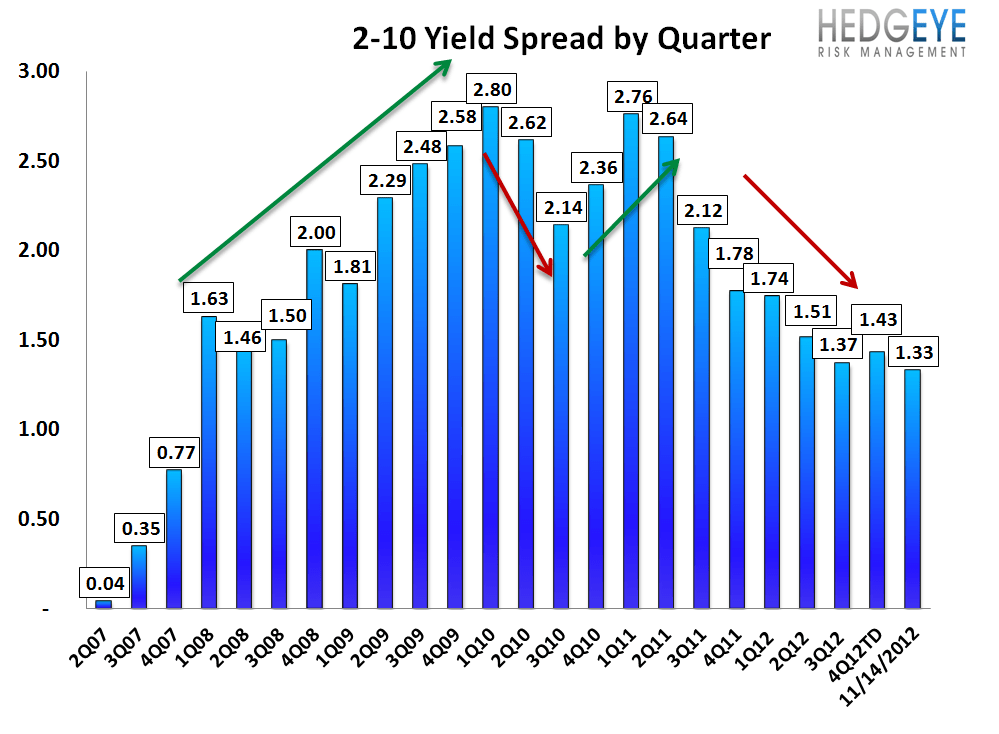
The 2-10 spread fell 3 bps WoW to 133 bps. So far 4QTD, the 2-10 spread is averaging 1.43%, which is up 6 bps relative to 3Q12.

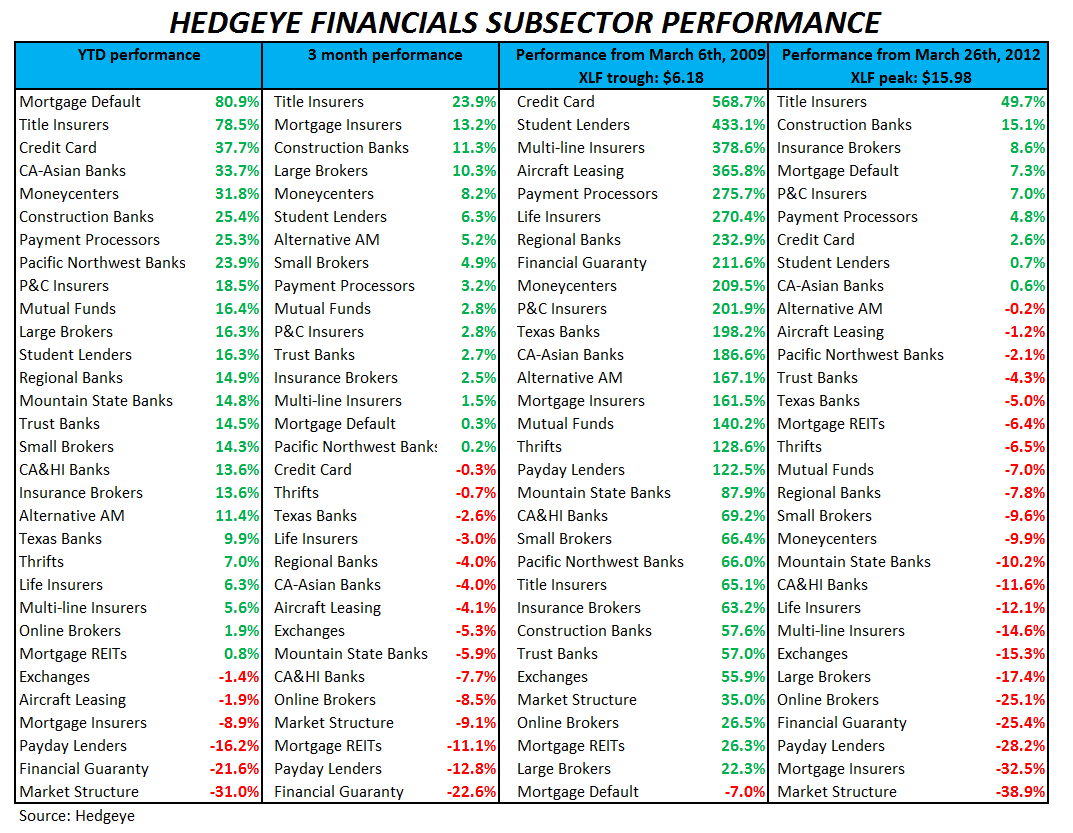
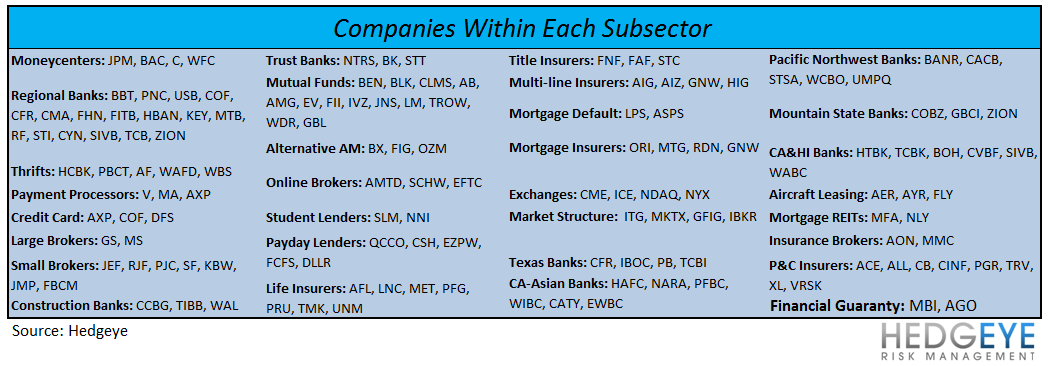
Financial Subsector Performance
The table below shows the stock performance of each Financial subsector over multiple durations.
Joshua Steiner, CFA
203-562-6500
Robert Belsky
203-562-6500
