


This commentary was written by Dr. Daniel Thornton of D.L. Thornton Economics. Thornton spent over three decades at the St. Louis Fed as vice president and economic advisor. To read Part 1 click here.
In my previous essay, I presented the Figure 1, which suggests that the government’s concern about trying to balance the budget changed dramatically in early 1970s.
Prior to that, the government ran small deficits or in a few cases, small surpluses. All that changed by 1974 when the deficits started to be historically large.
Figure 1: The Federal Surplus or Deficit in Current Dollars, 1913 to 2020

I pointed out that the figure was essentially the same whether it is in real dollars, per capita real dollars or as a percent of GDP. I suggested there were three possible causes for this change: Johnson’s Great Society programs, the Congressional Budget Act of 1974, which gave Congress more control over the budget and the president less, and the rise of Keynesian economics to economic orthodoxy. I stated that all of these are worthy of consideration.
Two economists, who are friends of mine, responded with a fourth suggestion. The first suggested I add “the reluctance of Congress to raise taxes.” The second said: “Looks to me more like Reagan, Nixon, Bush and Trump are the cause.” This essay is a response to these comments.
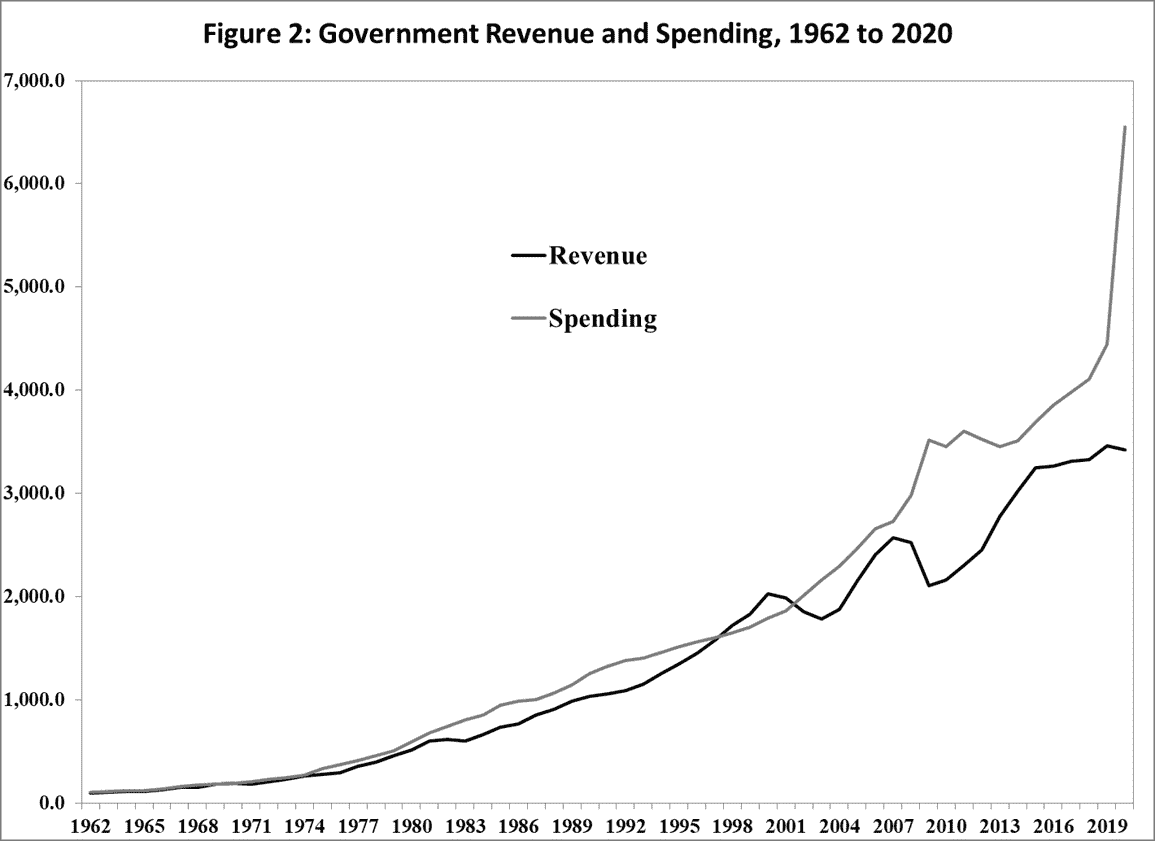
Figure 2 below shows total spending and total revenue over the period 1962 to 2020. These and all of the following data were obtained from the Congressional Budget Office’s webpage, Historical Budget Data as of February 2021, here. Figure 2 illustrates what Figure 1 suggests. Specifically, the government increased spending without concern about how or even whether the increased spending was financed.
Either Congress was reluctant to raise taxes sufficiently to cover the increased spending or it simply didn’t care about its budgetary implications. A likely reason Congress didn’t increase taxes to pay for the increased spending is because the tax increase that would have been required to balance the budget would have had to be very large.
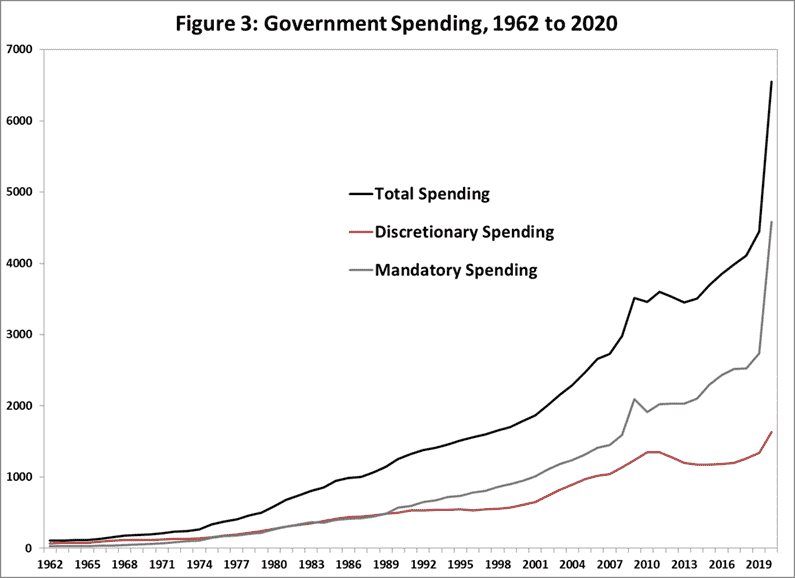
In an attempt to get at the issue of whether any president is to blame, Figure 3 shows total government spending and the amounts that are due to discretionary and mandatory spending. The figure shows that both discretionary and mandatory spending increased at essentially the same rate until 1989.
After 1989 mandatory spending continued to increase, while discretionary spending leveled off. While both types of spending contributed about equally to the increase in deficit spending up to 1989, mandatory spending has been the major deficit culprit since then.
The classification of mandatory spending is somewhat misleading because much of the spending that was undertaken in the wake of the financial crisis and Covid-19 is treated as mandatory rather than discretionary spending. This is due to the government’s accounting procedures.
Nevertheless, there is something to what my second commentator said about the deficit and the presidents. Figure 4 shows total discretionary spending and its defense and non-defense components.
The figure shows increases in defense spending under Presidents Reagan (1981-1989) and Bush II (2001-2009). Non-defense expenditures trended up over the entire period.
The bump in non-defense spending between 2009 and 2012 is due to efforts made to ameliorate the effects of the financial crisis; the spike in 2020 is due to efforts to diminish the effects of Covid-19. Defense spending declined under Bush I (1989-1993) and there was no significant increase in discretionary spending under Nixon (1969-1974).

Increases in discretionary spending contributed to the deficits from the late 1960s to 1989, but the huge deficits since 1989 are almost entirely due to increased mandatory spending. Figure 5 shows that most of the increase in mandatory spending is due to Social Security and Medicare, and to a lesser extent Medicaid.
The spike in mandatory spending between 2009 and 2012 and in 2020 were categorized as Income Security in mandatory spending in spite of the fact that these expenditures were discretionary.

EDITOR'S NOTE
This is a Hedgeye Guest Contributor piece written by Dr. Daniel Thornton. During his 33-year career at the St. Louis Fed, Thornton served as vice president and economic advisor. He currently runs D.L. Thornton Economics, an economic research consultancy. This piece does not necessarily reflect the opinion of Hedgeye.