

This commentary was written by Dr. Daniel Thornton of D.L. Thornton Economics.

In my previous essay I noted in 1976 Nobel Laurate, Robert Lucas, warned economists that historical relationships in economic data should not be considered structural. I went on to note some well-known and influential economists and many policymakers have chosen to ignore Lucas’ warning.
For example, Alan Blinder believes there is a structural relationship between inflation and the unemployment rate, known as the Phillips curve. He believes this in spite of the fact he said in an op-ed in the WSJ on May 3, 2018:
“Since 2000, the correlation between unemployment and changes in inflation is nearly zero.”
A more accurate statement is there has never been a compelling Phillips curve.
The Phillips curve was named after the New Zealand economist A. W. H. Phillips. In an article published in 1958, Phillips presented a scatter plot of the annual growth rate of nominal wages and the unemployment rate in the United Kingdom over the period 1861–1913. Phillips’ famous “Phillips curve” is presented in Figure 1.
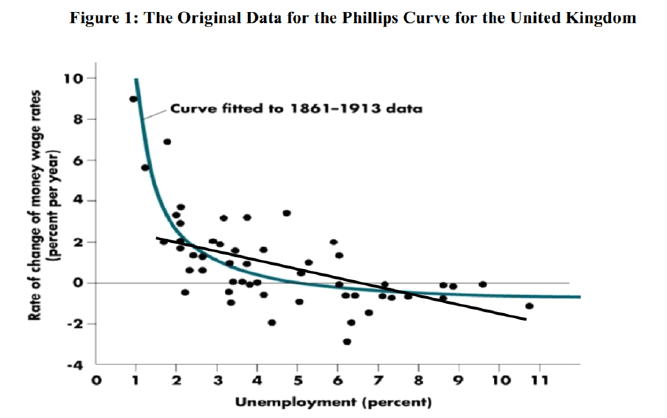
Note that the curved line Phillips fit to the data is due to 3 years when wage growth exceeded 5 per cent, 1871-1873. When these observations are ignored, the remaining 49 years suggest a slightly negative relationship that appears to be linear and not particularly strong, something close to the black line I’ve added to Figure 1. Phillips’ data are not available, so with the help of one of my wonderful granddaughters, I approximated Phillips’ data. When plotted, my figure looked remarkably like Phillips’. When these three observations were deleted from my data, the unemployment rate accounted for 25 percent of the variation in wage growth. Hence, 75 percent of the variation in wage growth was due to other (unknown) factors. This is not a particularly strong relationship, especially when one considers that Phillips’ data shows the relationship between wage growth and the unemployment rate, where one might expect to find a strong relationship.
In contrast, the “Phillips curve” that economists and policymakers look at is not the relationship between wage growth and the unemployment rate, but the relationship between inflation (the rate of change in an index of prices) and the unemployment rate. Whatever the strength of the relationship between wage growth and the unemployment rate, the relationship between inflation and the unemployment rate should be much weaker. For one thing, this relationship should change with changes in the price of labor relative to the price level. For example, if labor productivity increased, wages should increase while prices should fall or at least be unchanged. Consequently, there is no particular reason to believe that a relationship between wage inflation and the unemployment rate should translate well into a correspondingly strong relationship between inflation and the unemployment rate.
Then there is the fact that the unemployment rate can rise or fall with increases or decreases in the labor force participation rate (the percent of the working age population that is either working or looking for work). Hence, the unemployment rate can change for demographic and a variety of other reasons. Indeed, I pointed out (here) that much of the current low unemployment rate is due to a marked, and as yet unexplained, decline in the labor force participation rate since the recession ended in June 2009.
For all of these reasons, the relationship between inflation and the unemployment rate should not be very strong and will likely vary over time. This is shown in the Table below which shows the results of a simple regression of the inflation rate on the unemployment rate using monthly data from January 1948 to May 20019. The table shows the effect of a change in the unemployment rate on the inflation rate (denoted as UR and INF, respectively) and the percent of the variation of inflation explained by the unemployment rate for decades (120 months) starting in January 1948.
The results for the first decade reveal a fairly strong relationship between the unemployment rate and inflation. The estimated coefficient (-1.51) indicates that a 1.0 percentage point decline in the unemployment rate was associated with a 1.51 percentage point increase in inflation during the period. The percent of the variation of inflation explained by the unemployment rate is also high relative to the other decades, nearly 30 percent. However, this means that most of the variation of inflation during the decade was due to other factors.
The results for the remaining decades are much weaker. The coefficient for the second decade is much smaller as is the percent of the variation of inflation explained by the unemployment rate. The percent of the variation of inflation explained is slightly higher for the third decade, but the coefficient is positive, suggesting that a 1.0 percentage point decline in the unemployment rate was associated with a 0.53 percentage point decline in inflation during that period.

The coefficients for the remaining four decades are all negative, but generally tiny. Moreover, the unemployment rate accounts for virtually none of the variation of inflation. Indeed, when the last decade is expanded to include the data for 2018 and the first five months of 2019, the coefficient is positive.
Hence, the somewhat strong negative relation between the unemployment rate and inflation in the 1950s and 1960s should not be taken as evidence of a structural relationship that can be used to formulate economic policy. Unfortunately, some economists have been slow to accept this fact. A modified version of the Phillips curve, called the expectations-augmented Phillips curve, is a core equation in their models.
The Phillips curve hasn’t ever worked very well and hasn’t worked at all for at least 50 years. I think it’s time we stop talking about it as if it does and as if it is useful for formulating or implementing economic policy. While we’re at it, we should shelve another related concept called NAIRU—the non-accelerating rate of unemployment, i.e., the rate of unemployment for which the change in the rate of inflation is zero.
EDITOR'S NOTE
This is a Hedgeye Guest Contributor piece written by Dr. Daniel Thornton. During his 33-year career at the St. Louis Fed, Thornton served as vice president and economic advisor. He currently runs D.L. Thornton Economics, an economic research consultancy. This piece does not necessarily reflect the opinion of Hedgeye.
