Powerful comments from Hedgeye CEO Keith McCullough Thursday morning:
“I can’t let you lose all your money for the third time in the last 20 years. I can’t. You couldn’t pay me a billion dollars to go run a hedge fund right now. I want to help more people do modern risk management. It’s unbelievable, but the Old Wall is worse than they’ve ever been.”
After almost two years of uninterrupted stock gains, the market terrain has changed.
We want you to be prepared.
The #Quad4 Hurricane is already hurting many investors. More on that below—just know this new market environment has historically been very bad for U.S. equities.
Below are some critical remarks transcribed from Thursday’s edition of The Macro Show hosted by McCullough.
Watch this entire edition of The Macro Show below.
Keith McCullough: First, let’s talk about the dollar. Okay. So for those you that don't know, we went bullish on the dollar in April and, as you can see in the U.S. dollar charts, that was not a bad call.
We called it strong dollar and when you're bullish on something, you should only buy it when it pulls back to the low end of the Hedgeye Risk Range. So for those of you that are new, we publish daily Risks Ranges on things like the U.S. dollar and 25 other big macro assets. If you look at a dollar, again, just understand that the reason why we're bullish on the dollar is #Quad4. Okay? Quad 4, which is an environment in which U.S. growth and inflation are slowing on a year-over-year basis.
For nine consecutive quarters, US economy was in #Quad 1 (i.e. U.S. growth accelerating, inflation slowing) or #Quad2 (i.e. U.S. growth and inflation accelerating). You can see this in our four quadrant framework.
By the way, we were bullish on growth pretty much the whole way up and nailed the timing of this slowdown at the end of September. I’m not ashamed to say it because we certainly don’t nail everything. But the reason why we’re more right than wrong has to do with our risk management process. We don't start with how the economy feels or come up with a narrative like the “globally synchronized recovery.” You’ve got to check all that nonsense at the door and at least buy an insurance policy. That is indeed our four quadrant model.
Now the current macro environment is dramatically different than being in #Quad2, which you can see in that graph you were in #Quad2 from Q4 of 2016, all the way through Q3 of 2018. Now Wall Street got hit right square in the mouth with #Quad4.
What do you buy in #Quad4? Dollars.

McCullough: Okay. Let’s look at Asia this morning. What a mess. I’d continue to pay attention to what's been happening in the world since January when we went bearish on China and Emerging Markets. We also went bearish on Europe at this time last year.
So that's what you need to do in the morning. You need to measure and map not only the data but also markets. Look what happened this morning in South Korea for example. I mean the damn things down -22% from the 2018 highs. You’re getting all these bullish headlines across Old Wall media this morning talking about the bounce. South Korea didn't bounce. Japan is obviously a disaster too on the equity side. China is still down -26.8%.
Why is this happening? This is my map. This is my measuring and mapping process. So you’ve heard me say Quad 1, 2, 3, and 4, right? Let’s keep this super simple. 1s and 2s are good. 3s and 4s are bad. 4s are very bad. In fact, they’re like a hurricane.
So as you can see, we have the top 20 countries by GDP in the world. If you look at the chart, red and yellow is bad. Green is good. So looking backwards, the median and the mode of the world was great. Look at the U.S. The U.S. went on a run of nine consecutive quarters of green.
As you can see, that just ended in the third quarter. Then you get the red. And that’s what the market is starting to discount. It's not only red in the U.S. now, but it's red globally. So, you can see we're in #Quad4 globally and we're in #Quad4 locally.

McCullough: Basically, my goal is to make sure you don't lose all that money when everybody else is complaining and whining.
I can’t let you lose all your money for the third time in the last 20 years. I can’t. You couldn’t pay me a billion dollars to go run a hedge fund right now. I want to help more people do modern risk management. It’s unbelievable but the Old Wall is worse than they’ve ever been.
So the VIX, volatility, let’s look at our Risk Ranges and keep this really simple. The Hedgeye Risk Range on the VIX right now, is 18 to 25. So if we see a VIX level between the 17 to 19 range, start putting on your shorts. Then, once we get to the top end of the range of volatility call it 25, 26, 27, and people are losing their minds, you can cover your shorts. Today, our power users have got to be licking their chops because our data is showing you complacency and capitulation across equity markets.
Let’s go to the Sector Scorecard quickly. This is what we want you to do. In #Quad4, we want you to be buying Utilities (XLU) and Consumer Staples (XLP). And guess what? You should have a wonderful catalyst on that tomorrow. This wonderful catalyst would be if you get wage inflation. We're going to achieve jumped conditions in wages, which is our call tomorrow because there's an easy year-over-year comparison for average hourly earnings (because of hurricane related distortions this time last year) and the relationship between U3 and U6 continues to narrow alongside slack in the labor market. That typically perpetuates wage inflation.
So you're probably going to see a big wage number tomorrow. You know what all the bond bulls are going to do on that. They're going to be yelling about that. They're going to be telling you, 'Oh my God, there's wage inflation.' You know what? Ramping wage inflation happens 100% of the time at the end of an economic cycle.
So that's not new. It's called the latest of late cycle indicators. Understand it, absorb it, embrace it. You can buy bonds and buy Utilities and Consumer Staples tomorrow. Just wait another day. You buy those things when bond yields are at the top end of the Risk Range because they are bond proxies.
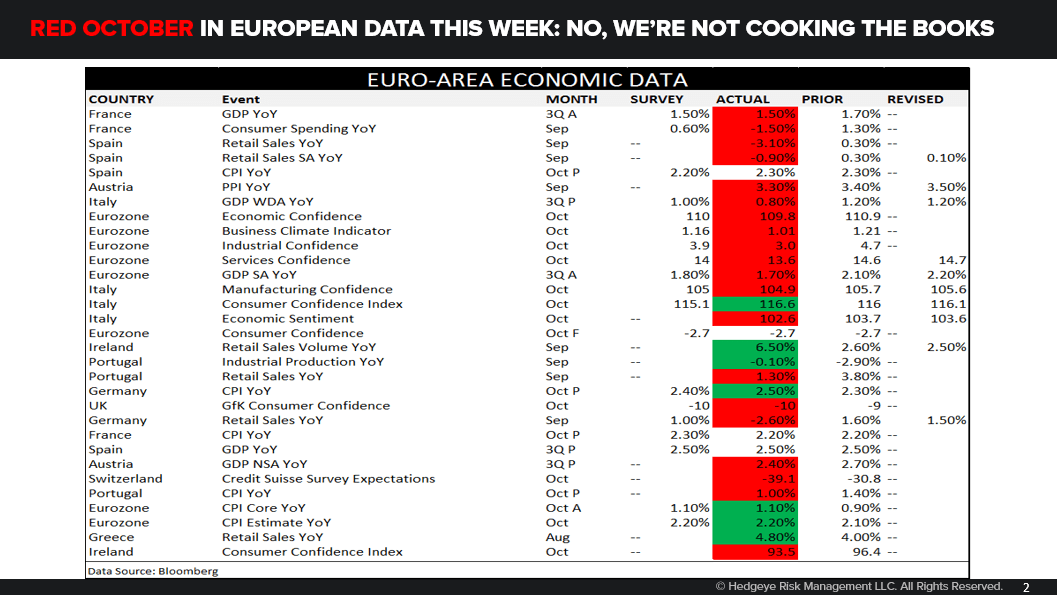
Now, to Europe. Oh my God. Look at the data this week. It's just red. I mean it's just bloody red. The economic data out of Europe this week has been bloody awful. German Retail Sales growth was down -2.6%, Spanish Retail Sales growth was down -3.1%, French Consumer Spending down -1.5%.
Now to be clear, in rate of change of terms, the word awful is not mathematically relevant. In our risk management process, we don’t care about levels. It's all about whether something is decelerating or slowing, we color code those in red.
What’s Europe slowing look like? Well, the Greek stock market continues to crash this morning. And people keep saying that stocks have stabilized, I can't for the life of me see how this is stabilized. The Greek stock market is down -30% since January. I mean that's not stable.