|
Our Macro team’s research process continues to indicate that Wall Street is on the wrong side of Treasury bonds. Despite the recent move higher in Treasury yields, we’re sticking with our contrarian call on long Long-Term Bonds. |
You’re going to want to watch the video below.
It features a selection of clips from a recent edition of The Macro Show with CEO Keith McCullough. McCullough explains in detail our #Quad4 in Q4 (i.e. Growth and Inflation slowing) outlook and how this will impact the our Long Bond call.
Below is the entire video and a selection of key transcribed excerpts of McCullough’s analysis.
Keith McCullough: Look at a chart of 2-year Treasury yields. I think most people know that bond yields have been going up for 2-3 years now but, in particular, the 2-year yield has been going up quite a bit this year. That’s because we’ve been in #Quad2. When you’re in #Quad2, growth and inflation are accelerating and what happens is the Fed sees that as hawkish and they raise interest rates.
So, the short end of the curve, the 2-year yield, continues to go higher. That’s mainly why I’m not long the 2-year yield.
Going forward, we’re mainly predicting that the Fed is going to predict what already happened on a lag.
The data, right now, is perpetuating this hawkish outlook because we’re getting the tail end of #Quad2 data. Yesterday, what got The Machines (i.e. hedge fund platforms) going on this huge technical move in bonds, was the ISM Services headline that hit a new all-time high. So you had that. You had European bond yields go up. And then you get a move above the prior 10-year Treasury yield closing high from May.
Again, The Machine is constantly delta hedging, feeding off itself, during, throughout and after a move, and then you get a capitulation. Remember, 85% of trading is “systematic,” meaning it’s mechanical. I think that’s what’s happening here. It doesn’t mean that I’m not wrong on bonds today. I’m just trying to articulate what’s going on.
Moreover, there’s another hawkish data point tomorrow (the Jobs Report) that supports what investors have not understood. That we’ve been in #Quad2 or #Quad1 for 9 quarters in a row. Understand this. Tomorrow’s Jobs report is Q3 data. Also, don’t forget that last year in September nonfarm payrolls got hammered by Hurricane Harvey so the year-over-year jobs growth is comparing against a demolished number. That’s hawkish.
The market has been discounting this. The question now is: When does it stop doing this? When does it start to see U.S. growth slowing? The answer is, it happens slowly, then all at once. But over that time period it can squeeze your brains out like it did yesterday.
This is all part of a topping process. Market timing is not easy. No part of this is easy.
And the point is if you’re running a portfolio, the way to hedge any long position is to have a good short idea. You want asymmetry.
Say you have 10 longs and 10 shorts. Hopefully, you don’t have 10 bond longs and no shorts. That’s stupid. You want to have 3 or 4 bond proxies and 3 to 4 bond positions. On the short side, you want Brazil, Emerging Markets, China and all of Europe. To me, our shorts have never been better.

McCullough: Getting back to our bond call.
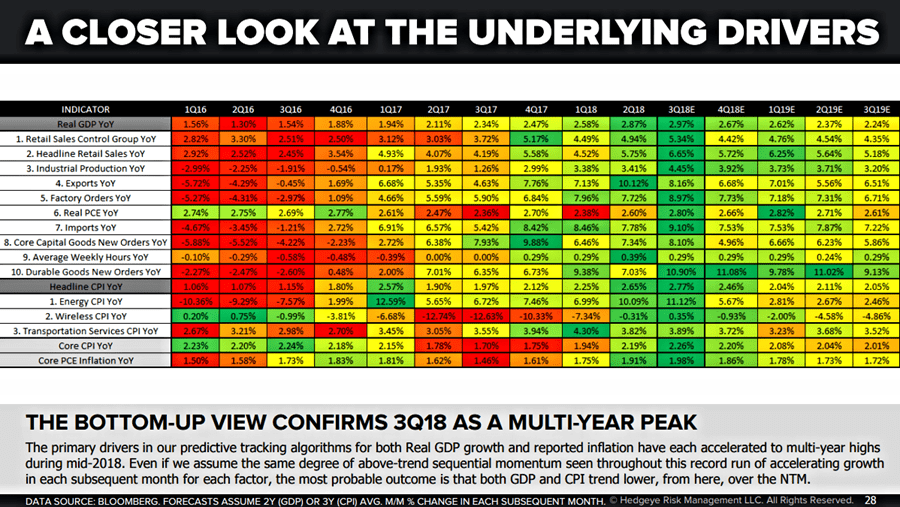
This picture (see chart above) is why we’re getting long bonds. We’re talking about the comparative base effects for U.S. GDP. For the 4th quarter of 2018, 1st quarter and 2nd quarter of 2019 you see the 2-year average of the comparative base effects for U.S. GDP at 2.2%, 2.25% and 2.50% respectively. Don’t forget that U.S. growth looks awesome right now because you’ve had easy compares, at 1.79%, 1.7% and 1.9% for 1Q 2018 to 3Q 2018.
Now, we’re talking about a material step-up from here for both growth and inflation. Again, that is the number 1 picture on why we’re getting long bonds and short growth.
Furthermore, if you look at GDP by line item, from 1Q 2016 to 3Q 2016 when we said go long bonds, the data was extremely red. Then the data got better and moved from red to max green by 3Q 2018. All of this data being reported now is #Quad2.
Looking back, if you shorted bonds from 3Q 2016 to the max green data in 3Q 2018 you’re crushing it. Now, we’ve changed our outlook. The reason is because we’re going from max green to yellow. That’s when you want to be long long-term bonds. We’re going from green to mellow yellow. The alternative view on Wall Street is that the data is going to remain green forever after a record run of 9 consecutive quarters of growth accelerating.
CLICK HERE to watch this video.