Editor's Note: Below is a brief excerpt from today's Early Look written by Macro analyst Ben Ryan. Click here to learn more about the Early Look.
|
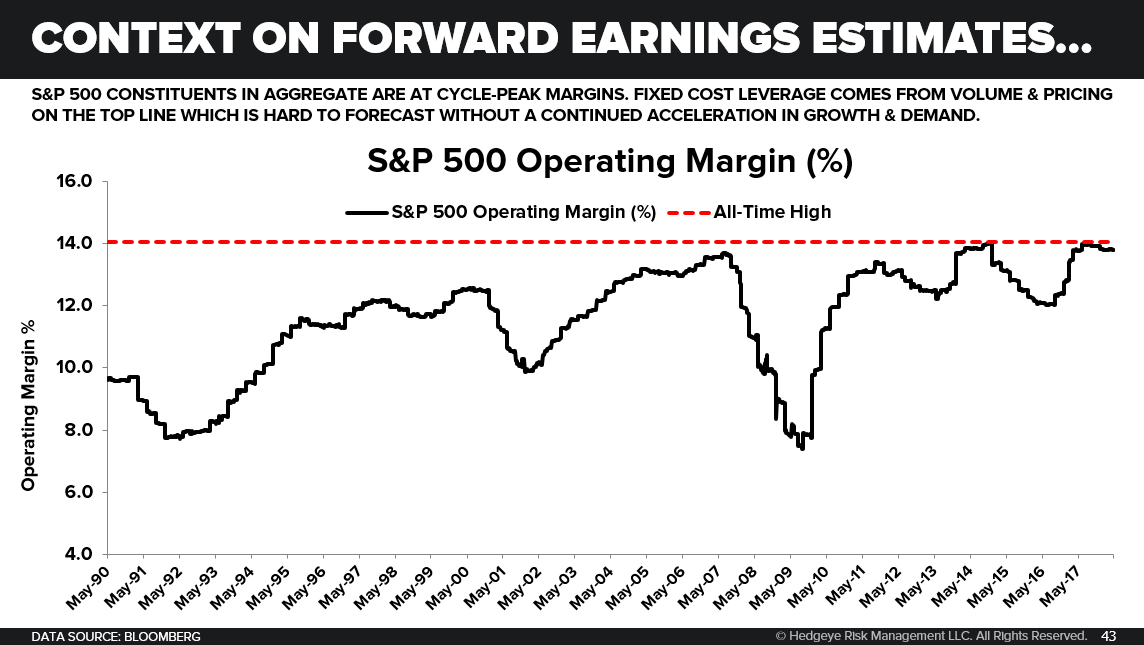
“All-Time Highs”, “All-Time Lows”, or “Cycle-Highs” are easy and catchy call-outs and you need history before you have some good click-bait. Context, however, is key which you learn quickly. As we show in today’s Chart of the Day the S&P 500 in aggregate is just barely off printing its all-time peak operating margin of 14% in Q2 & Q3 of 2017. Thirty years of operating margin history 1) is not a long time and 2) may not account for structural changes. Fine. However, relatively easy compares, a QUAD1 margin story, anticipated tax changes, and the favorable currency translation effects for U.S. multinationals were a favorable bottom line cocktail that kept the earnings growth train going right through Q1 of 2018. |