
“The tendency to revise the history of one’s beliefs in light of what actually happened produces a robust cognitive illusion… the “I-knew-it-all-along” effect.”
–Daniel Kahneman, Thinking, Fast and Slow
Investing narratives are bathed in revisionist history.
Intuitive and compelling storylines invariably come into sharp focus mostly only after the fact.
And for professional purveyors of Panglossian or pessimistic platitudes, “predicting the past” via ex-post punditry is easier to craft (& sell) than proactive risk management.
Recall the core tenets of successful CYA consensus investing:
- If everyone is wrong then no one is wrong
- If you have enough “indicators”, one will always be right. In other words, if your narrative-backfill stable has enough horses, you can always point to the one that happens to be working and claim analytical victory.
Anyway, apologies for the punchiness … no sleep and snark are positively correlated.
Back to the Global Macro Grind…
Reflation’s Rollover and Reflation’s Re-percolation were fairly obvious for anyone measuring and mapping the data.
You didn’t even have to be paying attention that diligently as the base effect math did most of the probability weighting for you.
Even better, you could have just let us pay attention for you. Here’s what we said back in February:
|
"Oh… and after threading the disinflationary needle and traversing the hardest CPI comps in February we get to manage the reflationary impulse of lapping trough comps in some of the componentry that drove reflation’s rollover mid-year last year – namely, all-time lows in healthcare inflation and the step function decline in wireless pricing associated with the cellphone price wars. But that’s a discussion for another time." |
After watching Inflation Expectations and nominal yields roll-over conspicuously (and globally) alongside relation’s peak and the more discernible emergence of global divergences (our 1Q18 and 2Q18 Macro Themes), that “another time” was our 2Q Macro Themes call.
The pickup in yesterday’s reported inflation data for March was fairly ubiquitous:
- Headline CPI: accelerated +16 bps to +2.3% Y/Y, marking the fastest pace of price growth in a year.
- Core CPI: accelerated +27 bps to +2.12% Y/Y, marking the fastest pace of price growth in a year.
- Owner’s Equivalent Rent = 23.6% Weighting = accelerated +20bps to +3.2% Y/Y.
- Wireless Services CPI = 1.54% Weighting = accelerated a full +700 bps to -2.4%. The cellphone price wars began in earnest in March of last year and comped down ~-12% Y/Y over the subsequent 12 months (we began comping out of the this month). Wireless services only carry a 1.5% weighting in the CPI basket but when the magnitude of change is that large it matters to the headline (even at a 1.54% weighting, down -13% Y/Y represents a -20bps drag on headline growth).
- Medical Care CPI = 8.7% Weighting = accelerated +23 bps to +1.99% Y/Y. Again, we will be comping the all-time lows in medical inflation as we move into 3Q18.
- Energy Commodities = 3.7% Weighting = decelerated -140 bps to +11.3% Y/Y. The reflationary impact of energy will emerge as we move through 2Q18 and as comps for energy commodities move from 29.8% Y/Y (February 2017) to +0% Y/Y (June 2017). Oil is currently tracking up +22% Y/Y on a monthly average basis in April and will be up 37% Y/Y in June if we hold current price levels.
- Core Goods and Services: Core Services (Services less energy services) price growth accelerated to +2.9%, while Core Goods (Goods less Food and Energy) accelerated to -0.3% Y/Y, both marking the fastest pace of price growth in 14 months.
- Median & Trimmed Mean CPI: The median and trimmed-mean CPI – alternate measures calculated by the Cleveland Fed and meant to better capture underlying price trends – accelerated to +2.5% Y/Y and +1.9% Y/Y, respectively, in March.
- Sticky Prices CPI: Sticky Price CPI – a measure which tracks a selected basket of goods and services where price changes evolve more slowly – accelerated +20 bps to +2.36% Y/Y
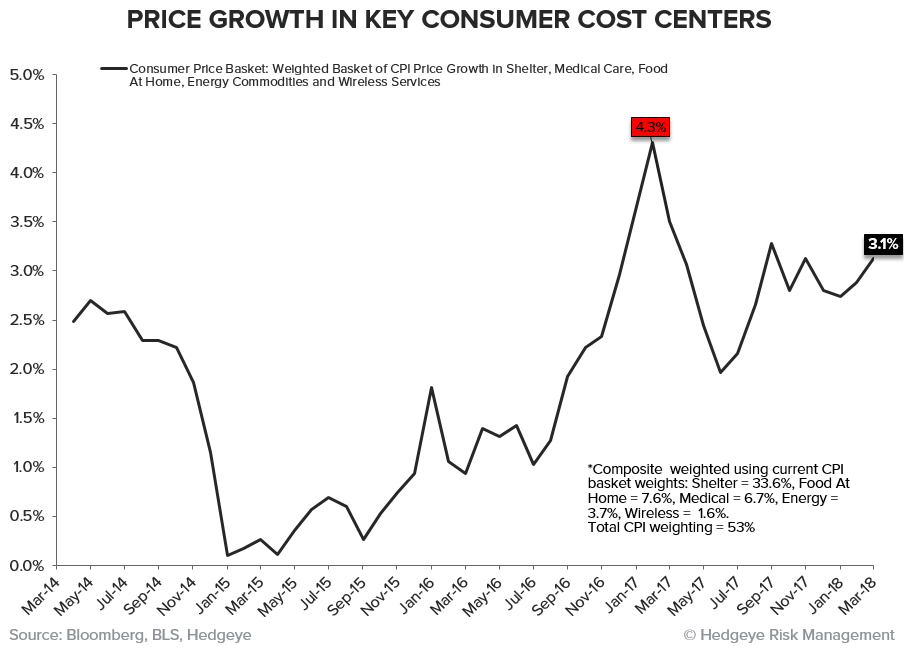
As can be seen in the chart above, price growth across our key consumer cost basket – whose items are large non-discretionary in nature - accelerated notably.
That acceleration also confirmed the inflation aspect of our #Quad2 forecast for 1Q and our expectation for range bound rates over the nearer term as the tug-of-price-war between inflationary pressure domestically and growth slowing/disinflationary pressure globally work against each other to find an equilibrium.
Switching gears, quickly, to a question I’ve been asked about a lot over the past month regarding the prospective phase transition in growth and volatility.
The Chart of the Day below is from our 2Q Macro Themes deck and plots the consecutive number of quarters of accelerating growth (x-axis) vs 90-day realized volatility on the y-axis.
There are a few simple but significant observations and one larger, equally significant implication:
- A realized acceleration in 1Q growth would tie us for the longest streak of accelerating growth ever.
- Protracted accelerations in growth perpetuate a positive, self-reinforcing cycle of low volatility and passive investment flows.
- Cumulative flows associated with investing in a particular regime/environment can be significant, particularly when that environment has persisted for the longest period ever.
- Because growth masks and/or predominates over pretty much every other investment factor/risk, imbalances can build and risks can cumulate latently .… until the growth cycle inflects
To draw a parallel, consider “the Great Moderation”.
In hindsight the great moderation was really a forestallment of natural economic cycling in favor of the secular accumulation of latent risk which would explode in spectacular ‘slowly-then-all-at-once’ fashion in the Financial crisis.
Each successive economic cycle was an exercise in Penrose (monetary) policy engineering designed to simultaneously mask the imbalances built-up in the previous cycle while attempting to recreate that same cycle again (while cumulating more of the same imbalances).
Thirty+ years of lower highs and lower lows in interest rates were great until there were no more lower lows to be had, the regime met its terminal end the flow reversed on those accumulated imbalances.
And that is the whole point about the accumulation of exposure associated with passive flows under an accelerating growth, low volatility, weak dollar regime. That regime was stable and flows were allowed to accumulate for the longest time-period ever.
What happens if/when we get a true phase transition and that accumulated exposure wants to reverse.
Escalator up, window down is how that saying goes.
That isn’t a near-term prediction. It’s just an interesting dynamic with a rising probability to consider as latent risks have a stealthy tendency to become not so latent when the macro starts traversing the back side of the growth curve.
On that cheery note, at least it’s Friday, right?
Our immediate-term Global Macro Risk Ranges (with intermediate-term TREND views in brackets) are now:
UST 10yr Yield 2.71-2.84% (bullish)
SPX 2 (bearish)
NASDAQ 6 (bearish)
VIX 17.37-24.49 (bullish)
USD 88.73-90.25 (neutral)
Oil (WTI) 61.63-66.97 (bullish)
Gold 1 (bullish)
Copper 2.95-3.16 (bearish)
Christian B. Drake
U.S. Macro analyst

