


Editor's Note: Below is a brief excerpt from today's Early Look written by Hedgeye Macro analyst Ben Ryan. Click here to learn more about the Early Look.
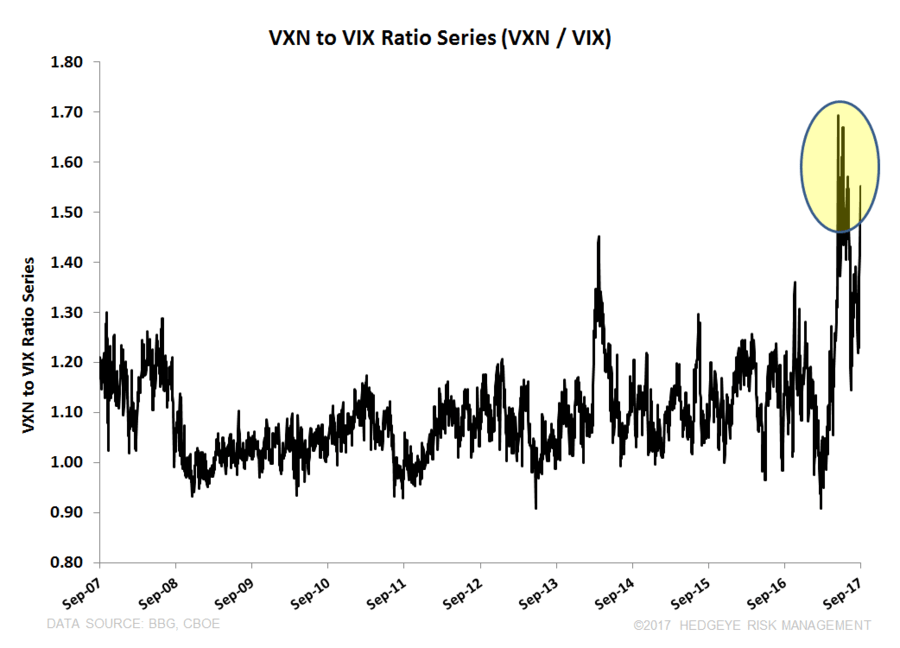
Looking at relative volatility expectations within U.S. markets, a ratio series of the Nasdaq 100 volatility index (VXN) relative to the S&P 500 volatility index (VIX) currently trades in the 99th percentile of historical observations based on a 10yr time window (see Chart of the Day above).
VXN was introduced as an index in February 2001, so if we pull back the curtain to inception, this VXN/VIX ratio currently trades in the 91st percentile. The index was created in front of the last, and possibly most violent, leg of the tech bubble aftermath from January to April of 2001 – this period is the only point in time that this VXN/VIX ratio was pushed higher.

