

Editor's Note: Below is special guest commentary written by Stefan Wieler from Goldmoney

For the past few months, gold prices have largely followed the moves in nominal interest rates. Depending on how one analyses the correlation between gold prices and nominal interest rates (10 year US government bond yields), the correlation coefficient is anywhere near record lows and the lowest levels since data is available (1962), meaning that gold prices have recently moved almost perfectly diametrically opposed to nominal interest rates.
This has led some commodity analysts and some in the financial media to question the recent recovery in the gold price from USD1130/ozt to USD1230/ozt that occurred despite an increasingly more hawkish outlook for the nominal interest rates path and to proclaim that gold prices are bound to move lower as the Fed keeps raising rates.
However, when measured properly, regression analysis shows that gold prices are linked to real-interest rates rather than nominal rates. And sure enough, the correlation coefficient between real-interest rates and gold is currently also at very low levels.

In a rare occasion, gold prices have moved closer with nominal rates than real rates over the past months. We noticed that the link between real-interest rates and gold is often overlooked in the daily media reporting in favor of anecdotes about “flows” in the gold market (e.g. at the time of writing, the gold headline on Bloomberg is “ETF buyers see bargains as gold rally stalls on Fed view” 14 March, 2017).
It appears that real-interest rates, even though clearly one of the main drivers of changes in the gold prices (see: Gold Price Framework Vol. 1: Price Model, October 8, 2015), are simply not enticing enough to report on. But nominal rates seem to be, hence the increased attention lately to the record low correlation between nominal rates and gold and all the wrong conclusions that come with it.
We believe that the reason why gold prices have recently moved closer in line with nominal interest rates rather than real lies in the Fed’s departure from near zero interest rates. For nearly 8 years, interest rates in the US were close to zero and the Fed has bought trillions of dollars in assets.
As the Fed has been signaling for a while now that this period of unconventional monetary policy is coming to an end, it has sent seismic shifts through financial markets. The shifts in nominal rates are simply too large and dominate everything, hence the recent near-perfect negative correlation between gold prices and nominal rates.
Importantly however, there is no reason to believe that the fundamental relationship between gold and real interest rates that has existed for as long as data are available has changed. In our gold price framework we explained in detail why gold prices move with real rates and as long as gold is being regarded and used as a store ofvalue, this relationship will hold.
As we will explain, real interest rates are unlikely tosustainably exceed 1% in the coming years. The market's reaction to last weeks FOMC rate decision illustrates that perfectly (see Chart below). Yes the Fed raised rates another 25bps, yet real-interest rates (or to be precise, real-interest rate expectations as measured by 10-year TIPS yields) declined and gold traded almost 2% higher. Gold prices in USD made their lows the day after of the first Fed hike in December 2015 andare up almost USD200/ozt, despite Fed Funds rates being up 75bps.

The Fed’s forward guidance aims at 3% terminal federal funds rate at the end for the hiking cycle (end of 2019), and taking the historical performance of both realized inflation and Treasury yields into account that means real-interest rates have only little upside.
In fact, we think the odds are increasingly to the contrary. The Fed can only raise rates to 3% over the next three years if the US economy doesn’t hit a roadblock on the way, but that would make the current cycle the longest period without a recession in US history.
If the US does enter a recession however, the Fed’s room to maneuver will be extremely small. The current record period without recession was from 1991 to 2001 that ended with the bursting of the dotcom bubble and the Fed slashing rates by 5.5%. A similarly sized rate cut (which is about the average rate cut from the Fed in a recession) would push rates to somewhere around -2.5 to -5%, depending on how much the Fed had raised rates in the first place.

Needless to say, real rates this negative would be extremely bullish for gold prices. In the meantime, we think gold prices will likely remain somewhat tied to nominal rates over the short run, which should offer good entry opportunities.
The gold sell-off in late 2016 is often attributed to a rise in interest rates. 10-year Treasury yields rose from under 1.4% in July 2016 to 1.8% shortly before the US presidential election. Subsequently, yields rose to around 2.5% at present. During this period, gold dropped from over USD 1350/ozt to USD 1240/ozt the day before the election and fell further to USD 1128/ozt before recovering back to around USD 1230ozt at the time of writing.
The correlation between nominal rates and gold prices is either near or at the lowest levels since data is available (1962), depending on how it is measured. This has led some financial analysts and some in the financial media to proclaim that gold prices have much more downside should interest rates rise further.
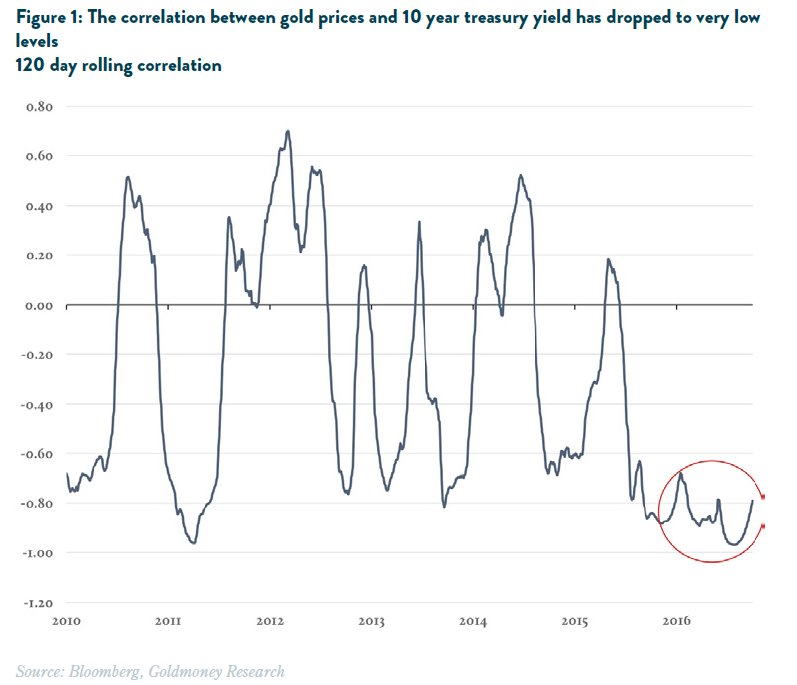
In order to prove this point, a chart similar to the one in Figure 1 is typically shown in an attempt to support the argument. The chart shows the 120 day rolling correlation of the gold price and nominal interest rates (10-year treasury yields) which indeed suggests that the correlation coefficient is at the very low end.
However, herein lies already the first fallacy. In finance, if anything, what matters is the correlation of changes (returns), not the correlation of levels (prices). For example, in a portfolio context, the goal is to minimize portfolio volatility given portfolio return goals, thus one needs to analyze return correlations, not the correlations between prices.
But there are also mathematical reasons why measuring correlations between nominal values should be avoided.
In a time series, prices can be expressed as:
P(0), P(1), P(2)… P(N)
Analogously, returns can be expressed as:
R(1), R(2), R(3)…R(N) where R(t) = P(t)/P(t-1)-1
Hence prices can also be expressed as
P(0), P(0)x(R(1)+1)), P(0)x(R(1)+1)x(R(2)+1),…
From the above formula it becomes clear why measuring the correlation of prices is problematic as it weighs returns early on in the time-series higher than later returns. If prices follow a random walk and the price of an asset goes up in the first period, then the likelihood increases that at the end of the measuring period prices are higher than at the beginning of the measuring period.
For example, the price of a stock at the beginning of the measuring period of 30 days is USD 100 and on day 1 it goes up 10%. If prices follow a random walk for the remainder of measuring period, then the probability that prices go up or down during the remaining 29 days is the same. Hence, after day one, there is a higher likelihood that on day 30 prices will above USD100 than below USD100.
WHAT IS CORRELATION AND HOW IS IT MEASURED?
In finance, correlation is used to express the degree to which two assets move in relation to each other. In mathematical terms, correlation is defined as the covariance of two random variables divided by the product of their standard deviations.
corr(x,y) = cov(x,y) / (stdev(x) x stdev(y)
The covariance is the joint variability of two random variables and is measured as the mean value of the product of the deviations of two random variables from their respective means. The covariance of two random variables depends on the unit it is measured in (for example, the covariance of two stocks measured in cents is different than the covariance of the same stocks measured in USD).
Thus, the covariance is divided by the product of the standard deviation of the two random variables for normalization. As a result, the correlation coefficient of two variables falls always between -1 and 1 where 1 reflects a perfect direct linear relationship and -1 a perfect inverse linear relationship.
Correlation and covariance are important concepts in portfolio management. A portfolio consisting of two assets that are perfectly correlated and have the same expected return will have an expected return and volatility equal to either asset. A portfolio consisting of two assets that are perfectly negatively correlated and have the same expected return will have an expected return equal to either of the asset but with zero expected volatility.
A portfolio manager tries to maximize returns given a certain risk tolerance (measured by the expected volatility of the portfolio). Hence, portfolio managers try to find assets with low or negative correlations in order to optimize the expected return and volatility of the portfolio.
Calculating correlations of levels (prices) rather than changes (returns) thus often yields strange results. Generally, if the returns of two assets have a positive correlation, the underlying prices often have a positive correlation as well. But sometimes that is not the case. Table 1 shows an example where the correlation of prices and returns yields a very different result. Further, in our experience, correlations of values are much more likely to take extreme values (close to -1 / +1).

Outside portfolio optimization, financial research analysts may use correlation analysis to show the degree by how much two variables are related. However, there are limitations to the significance of correlation analysis. The correlation coefficient gives no information about cause and effect. Correlation does not imply causation. More importantly, the correlation coefficient also does not allow to predict one value fromthe other.
Which method should be used then to show the relationship between interest rates and gold prices, the correlation coefficient of values or that of changes? The short answer is: likely neither. If the goal is to predict gold prices (or changes in gold prices) based on expectations for interest rates, a correlation analysis is of no help. Instead, a regression analysis with gold as the dependent variable may be used to develop a gold price model.
We have done that extensively and you can read up on the results in our gold price framework. However, if one simply wants to show whether there is a relationship between interest rates and gold prices, we think measuring the correlation of the changes is appropriate. After all, what one wants to show is whether gold prices tend to go up or to go down when interest rates fall or rise.
AND CHANGES IN GOLD PRICES
The 120 day rolling correlation of the generic 10-year treasury yield and gold is plotted in figure 2 below. As one can see, the correlation of the changes is not as volatile as the correlation of levels and less likely to reach extreme values.
This is actually more helpful, as it tells us that gold prices tend to be negatively correlated to changes in interest rates most of the time. It does however say nothing about the causality, whether interest rates drive gold prices or gold prices drive interest rates, or, whether both are driven by something entirely different. It thus also does not allow one to predict changes in the gold price based on changes in interest rates, even though that seems the plausible causality.
Assuming interest rates do drive gold prices, does a positive correlation mean that rising interest rates sometimes lead to rising gold prices? Not necessarily. The correlation only measures how the two variables behave over the measured period. A multivariate regression analysis is necessary to get a better understanding of the underlying drivers of the gold price.
The gold price could be affected by other drivers as well. In fact, in our gold price framework note we found that changes in longer-dated energy prices and central bank policies such as quantitative easing (QE) are equally important drivers and there are periods where these drivers undergo large shifts which dominates the gold price.

What can we learn then from analyzing the correlation between changes in interest rates and changes in gold prices? The very low correlation recently between the two tells us that gold prices and interest rates have been moving almost in tandem (reciprocal) over the past few months. However, we cannot simply conclude from this observation that with rising interest rates, gold prices will decline further.
REAL-INTEREST RATES RATHER THAN NOMINAL RATES DRIVE GOLD PRICES
Which brings us to the second misconception in the argument that gold prices will move lower as rates rise. In our gold price framework note, we identified real-interest rates as the driver for gold prices rather than nominal rates. Real interest rates are nominal interest rates minus inflation expectations. It is the expected real yield of a 10-year Treasury note.
Real-interest rates drive the demand for money (and thus gold) which is why there is a strong link between real interest rates and gold. Because nominal interest rates are one part of real interest rates (and inflation expectations the other), gold prices can move with changes in nominal rates when inflation expectations are stable.
This might give the appearance that gold prices are simply driven by changes in nominal rates when in fact they move with real-interest rates. We highlighted before why correlation analysis is most of the time an inadequate statistical tool if the goal is to find the underlying price drivers of an asset.
With that in mind, figure 3 shows that the correlation coefficient between real-interest rates and gold is much more stable over time and is almost always lower (and barely ever positive) when compared to the correlation coefficient between nominal rates and gold, consistent with our findings that real-interest rates are one of the main drivers for gold prices.

Interestingly though, the correlation between changes in gold and nominal rates has recently fallen substantially below the correlation between real-interest rates and gold, which is rare. In other words gold prices have been largely following the move in nominal rates.
We believe the reason for this lies in the Fed’s perceived departure from close to eight years of near zero interest rates and the potential reversal of trillions of asset purchases conducted under multiple quantitative easing programs, creating seismic shifts in financial markets.
The shifts in nominal rates are simply too large and dominate everything at present, hence the recent near perfect negative correlation between gold prices and nominal rates. The reason why the correlation between real-interest rates and gold has been somewhat lagging is that inflation expectations (measured as breakeven inflation from TIPS yields) has been moving higher since the election as well.
Part of that might reflect the markets’ view that future inflation might be higher as a result of the White House infrastructure spending plans. But inflation generally has been on the rise, which can’t be attributed to any of President Trump’s nascent polices (which have not even been decided yet).
But other than for nominal rates, where the impact was almost instantaneous, inflation expectations are only gradually moving higher. By now, inflation has almost caught up and real-interest rates are back to around 50bps. Gold prices did recover a bit, but not to the same extent. We think gold is still trading more off nominal rates than real-rates at this point.
What does that mean for the future? The fact that gold prices are driven by nominal interest rather than real rates is in our view a temporary phenomenon that came with the shift in market perceptions about the forward Fed interest rate path and will not last over the long run. In the end, as long as gold is regarded and used as a store ofvalue, gold prices will eventually reflect real-interest rates.
THE FORWARD PATH OF REAL-INTEREST RATES
What is the most likely forward path for real interest rates? Again, real-interest rates are nominal rates – inflation. So let’s look at the nominal rate side first. Nominal interest rates have been in a clear upward trend for a while now with the Fed determined to gradually raise rates for several years. The Fed itself has a forecast for terminal rates at 3% longer term (2020 and beyond).
What can we expect for bond yields in such a scenario? In our recent report (The Gold Sell-off: How far might it go?, December 2, 2016) we showed that bond yields are above Fed funds rates at the bottom of the cycle, but the two tend to converge at the peak of the cycle, see Figure 4).
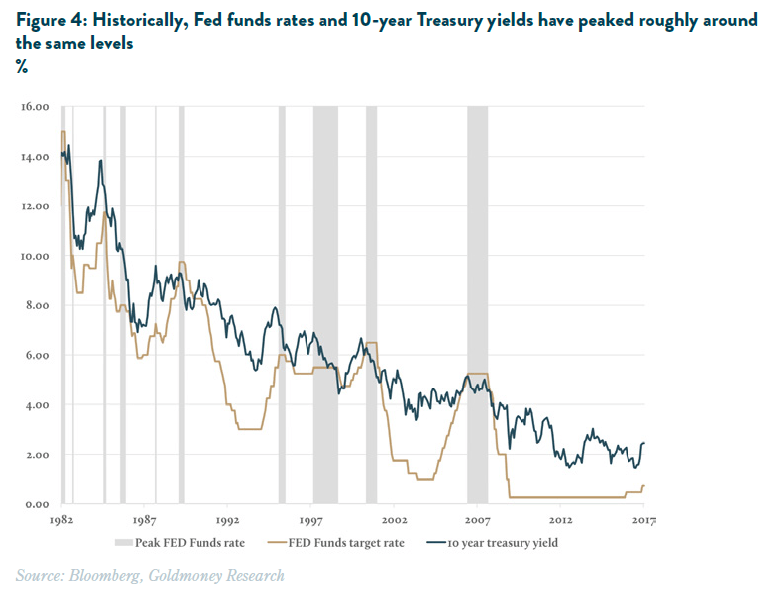
This suggest that the 2% differential between 10-year nominal rates and the Fed funds rate is unlikely to persist as the Fed keeps raising rates. As a result, the yield on 10-year Treasury will most likely not be substantially above 3% at the end of the Fed hiking cycle, even if the Fed gets to raise rates continuously over the coming years.
WHAT ABOUT INFLATION?
Inflation has been accelerating and this is reflected in inflation expectations as well. More specifically, CPI inflation in February has reached 2.7% year-over-year (from 1% in 2016 and below zero in 2015) while 5-year breakeven inflation expectations embedded in TIPS yields recently topped 2% (from a low of 1.25% in mid-2016).
In our view this was largely responsible for the market reaction (USD sold off and gold rallied) post-FOMC rate announcement. The market had expected that the Fed would present a much more hawkish forward guidance in light of the recent uptick in price inflation.
Yet the FOMCs dot plot (the expectations of individual FOMC members in regards to the Fed rate path) was almost unchanged from the December meeting, reflecting that the Fed does not believe the macroeconomic environment has materially changed. In that context it is also important to notice that the FED has a history of letting inflation exceed the target of 2% in a hiking cycle (see Figure 5).

For that, it is important to understand the different measures of inflation provided by government agencies. The two main inflation measures are personal consumer expenditure (PCE) and consumer price index (CPI). The main difference between PCE and CPI is the weightings of the various components. The CPI is based on a survey of what households are buying while the PCE is based on surveys of what businesses are selling.
The coverage of the two measures also differs, the CPI only covers out-of-pocket expenditures on goods and services purchased. Expenditures that are not paid directly (employer provided insurance for example) are excluded from the CPI but included in the PCE. In addition, the PCE assumes that consumers substitute for cheaper goods when the price of an item in the basket becomes more expensive.
Both measures come in two main flavors, headline and core. Headline measures all prices in the basket while core excludes food and energy. While naturally what really matters for consumers is headline (as they do eat and drive), food and energy prices tend to be more volatile and so the argument goes that core inflation is a better trend indicator where inflation is going (by omitting the noise).
Importantly, the Fed focuses on core PCE in regards to its inflation target of 2%. However, the headline CPI issued to adjust social security payments as well as the principal of Treasury inflation protected securities (TIPS).
In our gold price framework note we found that TIPS yields can be used to measure actual real-interest rate expectations. Figure 5 thus suggests that not only does the Fed seem comfortable letting core PCE exceed the 2% target during a hiking cycle (a view that has been reinforced by the latest FOMC meeting outcome), headline CPI (which is what drives gold prices) tends to come in substantially higher.
Following the end of the convertibility of the USD to gold in 1971, headline CPI exceeded core PCE by 0.8%per year. This increased to 1% over the past 10 years. Hence even with a 2% inflation target (and some regional Fed presidents are already advocating for a higher target), actual headline inflation will likely increase the target rate substantially in the current hiking cycle.
Therefore, even in the best case scenario, where the US economy continues to improve for years to come, allowing the Fed to gradually raise rates over the next four years to around 3%, realized real-rates at the end of the hiking cycle will likely be close to zero percent.
And because the Fed is unlikely to raise rates further if the inflation target of 2% cannot be met, this implies that real-interest rates should not go much over 1% even in the ‘Goldilocks’ scenario where the US economy does not encounter any slowdown or recession over the coming years.
As of today, the US economy has had 92 months of no (official) recession. That is less than 30 months short of the record 121 month period between 1991 and 2001, which ended with the bursting of the dotcom bubble and forced the Fed to lower interest rates by 5.5%. If the Fed really gets another recession-free three years in which to raise rates to their forecasted 3%, it would mark a new record.

But if we are not so lucky, then both nominal and real-interest rates will inevitably decline again. Because the Fed has just a very small buffer left (currently 0.875%), we would most likely see more unconventional monetary policy including quite possibly negative interest rates (NIRP) and more quantitative easing (QE). Whatever the Fed does deploy, expect real-interest rates to reach new lows (real-interests rates fell below -0.9% in 2012), which would likely push gold sharply higher in USD terms.
But even without a recession, real-interest rates simply don’t have much upside. At 3-4% nominal yields with 2% inflation, realized real rates would be around 1-2% at their peaks (currently 0.6%). That means even if the Fed has three more years to raise rates before we see another recession, the ensuing easing (the Fed slashes nominal rates by around 5% on average) would push real-interest rates to new lows around -3-4%, with inflation anchored at 2%.
In other words, we think real-interest rate expectations have already peaked in early 2016. Over the short run, gold prices might continue to trade closer in line with nominal rates, which means as the Fed is hiking and the market believes it will continue to do so, gold might face some headwinds. But we believe gold prices will eventually trade more in line with real-interest rates again, which implies that any further sell-off will prove unsustainable over the medium to long term.
EDITOR'S NOTE
This is a Hedgeye Guest Contributor research note written by Stefan Wieler for Goldmoney Insights. Wieler was previously a senior commodity strategist at Goldman Sachs. This piece does not necessarily reflect the opinion of Hedgeye.
