


The reflexivity of the back of a debt-funded peak capital spending boom in resource-heavy sectors looks much tamer than it did in February and March. High-yield energy OAS has been more than cut in half since February (+720 from +1600 in Feb), with the BGG high-yield energy index +42% off the 2016 lows.
Relief in spot prices and a continuing flattening in the yield curve have been large drivers, but credit has been largely immune to the most recent leg-down in crude since June 8th. High-yield energy OAS is 100bps tighter over the same period and has nearly reverted back to cumulative high yield spread levels since the dollar broke out in July of 2014:


Below we offer a short outline of a key Q3/Q4 debate with regard to the large amount of capital getting behind a recovery in the energy sector.
Is the consensus opinion short a capacity-driven turnaround at current levels, or is there room for another leg down?
- More than $100Bn has been raised from buy-out firms and distressed debt funds over the last 2 years - BBG
- According to an E&Y survey in June, the 100 PE firms that partook in a survey had ~$1T of dry powder to sink into the oil & gas sector – 25 said they planned to get something done by year-end 2016
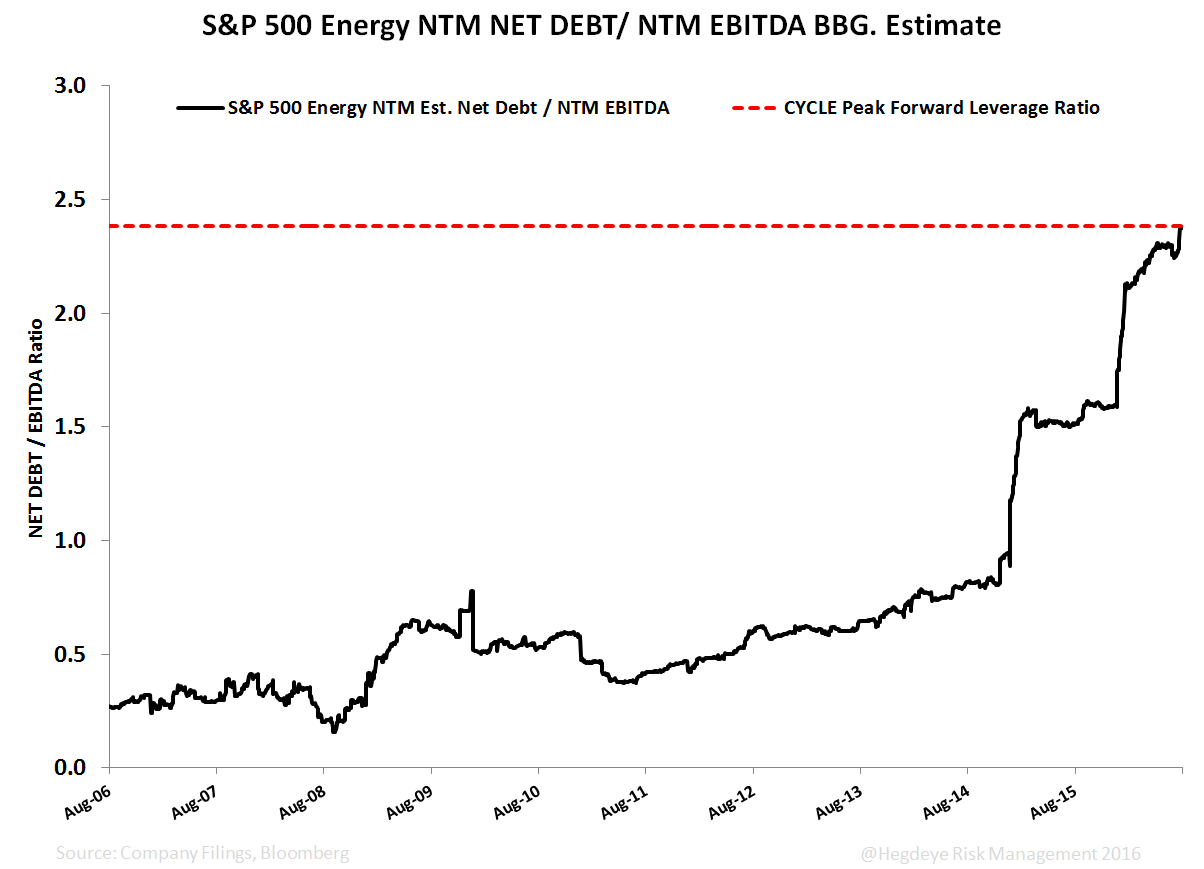
The space as a whole looks more levered, much shorter of the credit cycle, and longer of an industry recovery than it was 6 months ago. To hold current levels into year-end, S&P 500 energy companies may have to demand much higher multiples, looking more levered in the process without a sustained commodity price recovery.
- Corporate leverage broadly (median debt/ EBITDA) reached record highs this week as reported by S&P: LINK
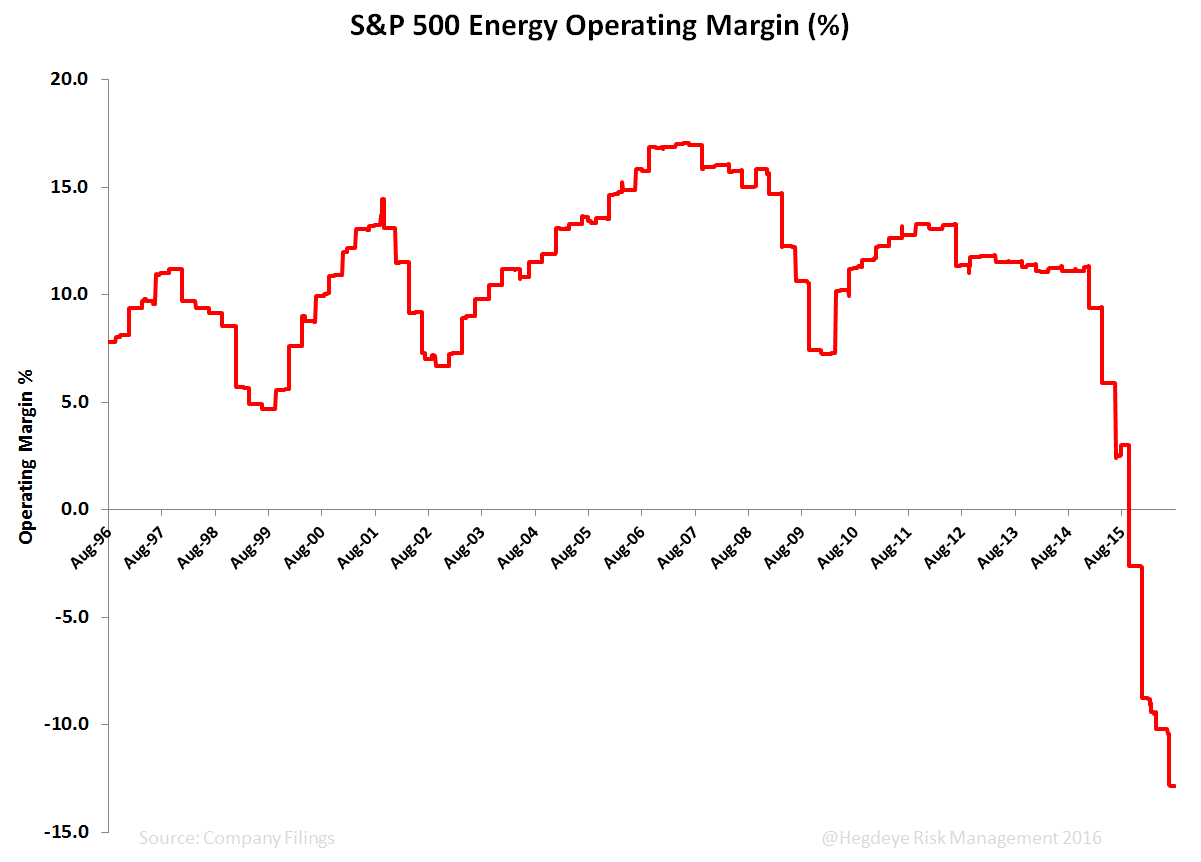
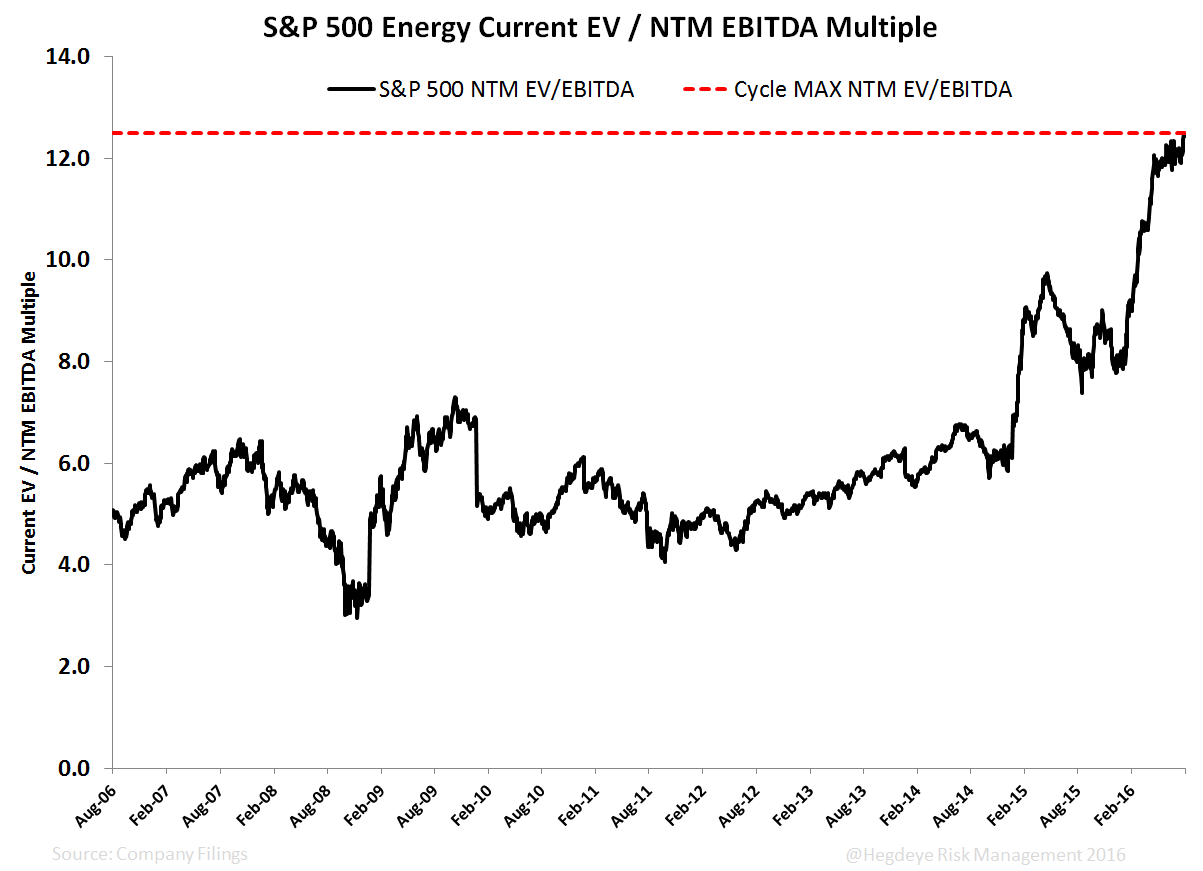
- With negative operating margins for S&P 500 energy constituents, EV / Forward EBITDA multiples and Net Debt / Forward EBITDA multiples touched a cycle peak today
- Expectations do not look completely blown out yet. Reporting season is finished for the 37 energy companies in the S&P, and earnings growth missed estimates by -9.5% vs. the S&P as a whole which has beaten estimates by 4.1% this far
- With regard to expectations, embedded in that peak cycle forward EV / EBITDA multiple is triple digit consensus earnings expectations for Q1 and Q2 of 2017

While cyclicals do tend to look most expensive when it’s time to look for opportunities:
1) Expectations that recover sharply by the end of 2016 may need to be taken down first
2) Year-end 2016 will bring another round of impairments, write-downs, and balance sheet contraction without a +10-20% rebound in prices in short order
3) Mgmt. guidance, realized prices, and 2015 price levels for the regulatory treatment of assets signals the worst could be over with the capital flush unless the bottom falls out in crude for the duration of the year (see the charts below for a sample of XLE members)
4) Capital in play per unit of production has shrunk which we called out in January as a #creditcycle catalyst before the first big round of asset revaluations. Given that domestic production has just started to roll, even many of the largest producers will need to fill the funding gap into 2017 (second chart below) - the need for incrementally cheaper funding or sustained lack of credit market deterioration would be necessary tailwind.


From a pure base effects GIP modeling perspective, energy and inflation comps broadly are much easier in the latter part of the year (our GIP model is currently tracking to Quad 3 and Quad 2 for Q3 and Q4 respectively). And given where forward rate hike expectations are currently, we’re wrestling internally with the next policy catalyst for the U.S. dollar that doesn’t involve some kind of “quantitative easing” in front of it.
We’re sticking to the top-down quantitative signals with regard to reflationary assets, and WTI has failed to breach its bearish TREND resistance level in recent weeks – to weigh in, we’re fine continuing to sit out a position when the market is trading at all-time highs and peak forward multiples with expectations that we continue to view as optimistic (consensus expects positive earnings growth in every sector by Q1 2017).
See the link for the most recent updated thoughts from our energy policy team with regard to renewed production freeze talks: Freeze September Sequel Will Have Similar Ending: No Agreement

