

Editor's Note: Below is a brief excerpt and chart from today's Early Look written by Hedgeye Financials analyst Josh Steiner. Click here to learn more.
"... Now consider the longstanding relationship described by Cliff Asness between current CAPE ratio levels [aka Shiller PE] and forward 10yr market returns (HERE). What he shows is that there’s a near perfect relationship between forward 10yr returns on the S&P 500 and starting CAPE ratio multiples over the last 85 years (see table below).
The market is currently trading at a CAPE ratio of 26.4x, which puts it in the 10th [the most expensive] decile. Forward 10yr real returns from this decile have averaged just +0.5% per year over the 1926-2012 period. The best period saw returns for this decile of +6.3% per year, while the worst saw losses of -6.1% per year."
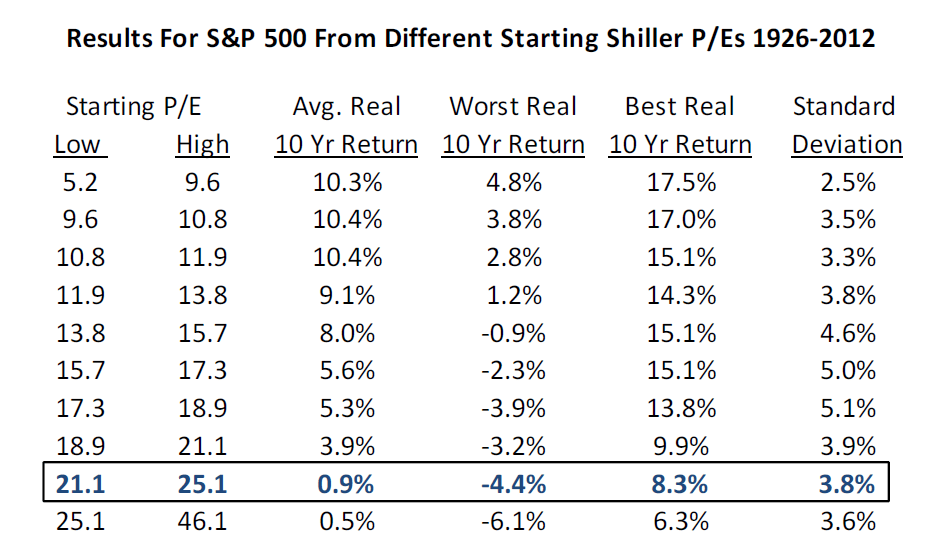
Source: Cliff Asness, AQR (An Old Friend: The Stock Market’s Shiller P/E)
