

Our Hedgeye Housing Compendium table (below) aspires to present the state of the housing market in a visually-friendly format that takes about 30 seconds to consume.

Today's Focus: February Existing Home Sales
Existing Home Sales were down -7.1% sequentially and decelerated to +2.2% YoY in February. We’ve known for over a month that February was going to be soft (see: PHS | Leaping ...Downward! or EHS | What Goes Up?) as EHS recoupled to PHS so the print was of little surprise.
Still, there are a number of callouts from this morning’s release:
Leap Year Distortion: Sales grew +2.2% year over year in February but the extra day in the period provided a +3.5% benefit. Net of the extra leap day, EHS were actually down -1.4% Y/Y.
Even Lawrence Yun, NAR’s chief economist, highlighted: “[The February decline] was Meaningful”
Supply Stagnation: On the inventory side, unit supply rose +3% sequentially to 1.88MM but remained -1% YoY (note: inventory is non-seasonally adjusted). The net of declining volume and rising supply drove inventory on a months-supply basis to 4.44-months – marking a second month of rising months supply but still well below the 2015 average of 4.81-months and the 42nd month below the traditional balanced-market level of 6-months.
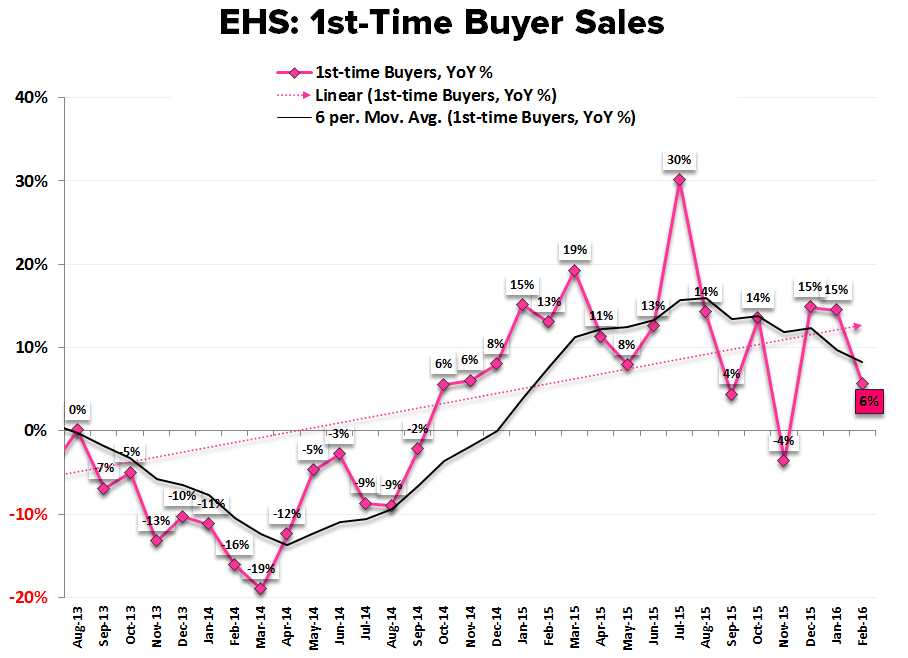
1st-time Buyers/Investors: 1st-time buyers fell to 30% of sales, implying a volume of 1.52MM units which was down -12.9% sequentially and decelerated to +5.7% YoY (vs +15% YoY in Dec/Jan). As Yun notes, investor sales have actually increased in recent months after trending consistently lower over the last few years,
"Now that there are fewer distressed homes available, it appears there's been a shift towards investors purchasing lower-priced homes and turning them into rentals. Already facing affordability issues, this competition at the entry-level market only adds to the roadblocks slowing first-time buyers."
Big Picture | Tail Chasing: A dynamic and sustainably fluid housing markets requires a delicate supply-demand-price balance. The imbalance prevailing in the existing market currently stems primarily from the supply side.
A tight supply--rising price spiral resolves when:
- Declining affordability drives increasingly weaker demand which, at some critical threshold, acts as an anchor on further price growth or catalyzes a negative inflection in HPI.
- Rising prices incentivize inventory and the imbalance resolves from the supply side.
- Some combination of the two
Historically low rates, top heavy demographics (↓ mobility/turnover), low equity positions and tight credit continue to sit as both cyclical and secular constraints on supply. Alongside stagnant income growth, low equity (trade up buyers), tight credit, and demographics (lagged improvement in millennial employment/income trends) have similarly served to constrain activity from the demand side.
Inventory tightness does not act as a ceiling on transaction activity when volumes are depressed but becomes a more tangible constraint as we push past average historical sales levels as we have over the past year. As yet, rising home values have not been sufficient to drive meaningful enough gains in equity to incent incremental supply. Instead, tight supply has manifest primarily in rising HPI - a trend whose negative impacts compound over time so long as price grows at a premium to affordability (f(x) = incomes & rates).
Empirically, the data in recent months suggests we are operating in a version of scenario 1 above whereby tight supply is/has driven declines in affordability in a negative tail-chasing feedback loop and is now constraining further upside in volumes as demand has already mean reverted. Low equity positions will continue to improve alongside price gains and the credit box can expand pro-cyclically (should the expansion continue) but rates, demographics and the trickle through of millennial renter households to single-family purchase demand all remain secular overhangs. In short, supply conditions may show gradual, partial improvement but are unlikely to resolve in the short-to-medium term.
Looking Ahead: We’re more interested in the Pending Home Sales data (Feb release = next Monday, 3/28) as the cleaner, more real-time read on the underlying trend in purchase demand in the existing market. As it stands, PHS have decelerated for 9-months off the April 2015 RoC peak and we continue to expect sales in the existing market to decelerate through 1H16 with a strong possibility for negative volume growth against peak PHS comps in April/May. Given the lagged relationship of home prices to volume (rate-of-change in home prices lag the rate-of-change in demand by 9-12 months) we expect HPI trends to flat-line and begin to roll as we move through 1H16, representing an addition fundamental headwind for housing related equities.


About Existing Home Sales:
The National Association of Realtors’ Existing Home Sales index measures the number of closed resales of homes, townhomes, condominiums, and co-ops. Existing home sales do not take into account the sale of newly constructed homes. Existing home sales account for 85-95% of all home sales (new home sales account for the remainder). Therefore, increases in existing home sales tend to signify increasing consumer confidence in the market. Additionally, Existing Home Sales is a lagging series, as it measures the closing of homes that were pending home sales between 1 and 2 months earlier.
Frequency:
The NAR’s Existing Home Sales index is published between the 20th and the 22nd of each month. The index covers data from the prior month.
Joshua Steiner, CFA
Christian B. Drake