

Our Hedgeye Housing Compendium table (below) aspires to present the state of the housing market in a visually-friendly format that takes about 30 seconds to consume.

Today’s Focus: New Home Sales for September
Well that wasn’t quite what we were expecting.
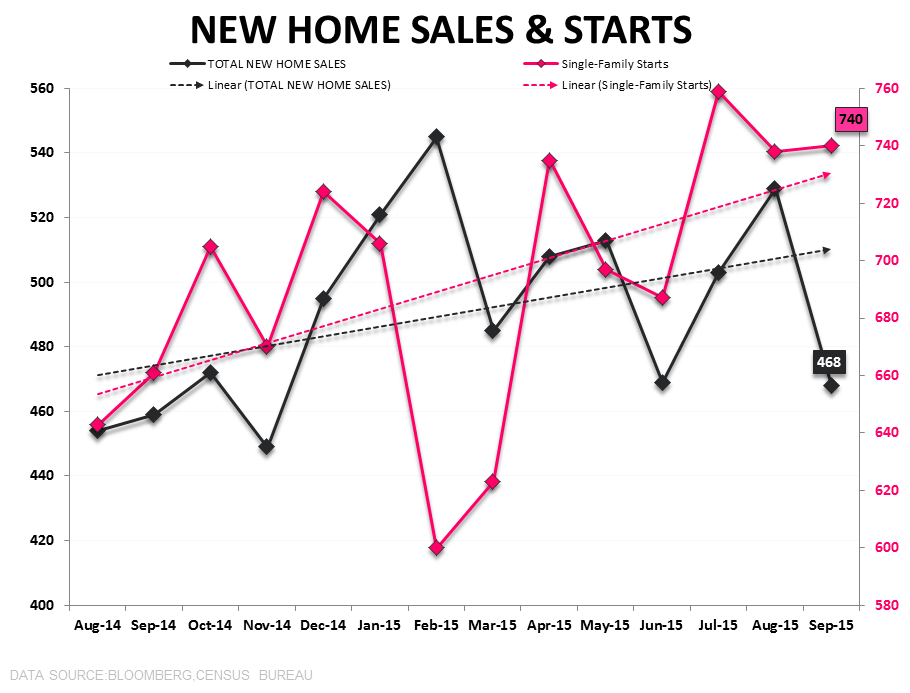
New Home Sales declined -11.5% MoM in September and decelerated to +2% YoY – marking the lowest level of sales in 10 months and well off the +20% year-over-year pace of growth averaged YTD.
Given the discrete pull forward in purchase demand (see 1st chart below) to close out September ahead of the impending TRID regulatory change on October 3rd, our expectation was for that bolus of demand to positively impact the September NHS and PHS figures and subsequently drag on the reported October data as the impact reversed.
So, what happened? In short, it’s unclear.
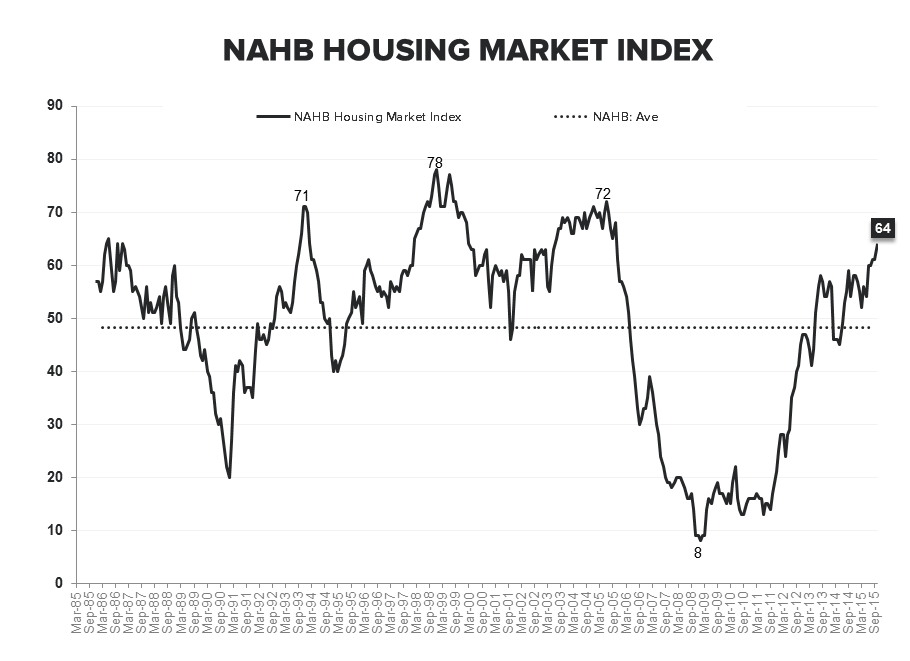
What we do know is that the MBA & HMI (Builder Confidence) Surveys are telling a story antithetical to the NHS data and there are only a few roads available to reconcile the data.
The MBA data is wrong, the NHS data is distorted, the preponderance of the pull forward occurred in the 90% of the housing market that is existing sales or some combination.
We'll get some additional clarity alongside the release of September PHS data on Thursday. Below is some simple forensics on the NHS data along with some common sense speculation:
The preliminary Monthly New Home Sales data are derived from the Census Bureau’s Survey of Construction ( SOF) and are imputed based on the issuance of permits. In other words, it’s a derived measure with significant standard error and not some direct count of contract signings. Further, NHS carry the largest revision of any resi construction related series - a reality which stems from the fact that the count is based on permit issuance and many homes have a sales contract prior to a permit being issued. Thus, if the apparent surge in late September activity occurred in the pre-permit phase, the impact would largely go un-captured by the preliminary survey calculation. In that case, the Oct/Nov releases would likely carry positive revisions.
In anyt case, definitely a soft print for NHS but given the regulatory noise and marked divergence from the MBA and HMI data, we’re content to wait for the PHS river card for confirming/disconfirming evidence on the underlying state of demand and any TRID related impacts.


Joshua Steiner, CFA
Christian B. Drake
