
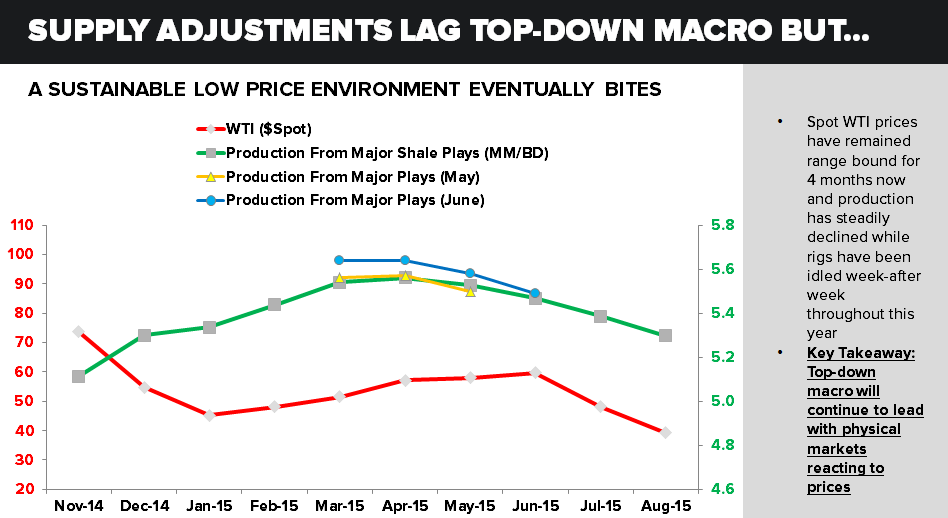
To answer our own question on when a domestic production slowdown will give a lift to crude oil prices, a rolling over of U.S. production would have to be much more drastic from a first and second derivative perspective for a fundamental and psychological price floor to develop.
Domestic production IS rolling over, but U.S. production remains resilient with production per region continuing to show lopsided Y/Y gains vs. what could (even optimistically) be absorbed:

The headline numbers from the EIA for monthly production have been scrutinized, but all production reported is subject to more accurate revision. In May and June the EIA upwardly revised previously reported production numbers for March and April. Data reported for August now shows the opposite type of revision. Previously reported production numbers have been downwardly revised.
The most updated production data shows that vs. June’s release, updated production levels for August have been downwardly revised for March, April, May, and June.
An ongoing argument continues as to whether the supply glut is in fact an excess of oil being produced or if the demand picture is just that poor. Arguments can be made for both, but for several reasons below we outline why overproduction will continue to overpower both demand for tight oil and infrastructural capabilities in the near future.
Production may be rolling over, but considering the fact that inventories still remain near all-time highs after going through a seasonal summer drawdown where motor gasoline consumption recovered to near pre-crisis levels and refinery capacity utilization touched all-time highs, it’s hard to argue weak DEMAND for refined products is the stronger factor contributing to a supply glut. Even after this week’s big draw, it’s reasonable to expect inventories to move right back to all-time highs, testing the logistical ability to deal with it.

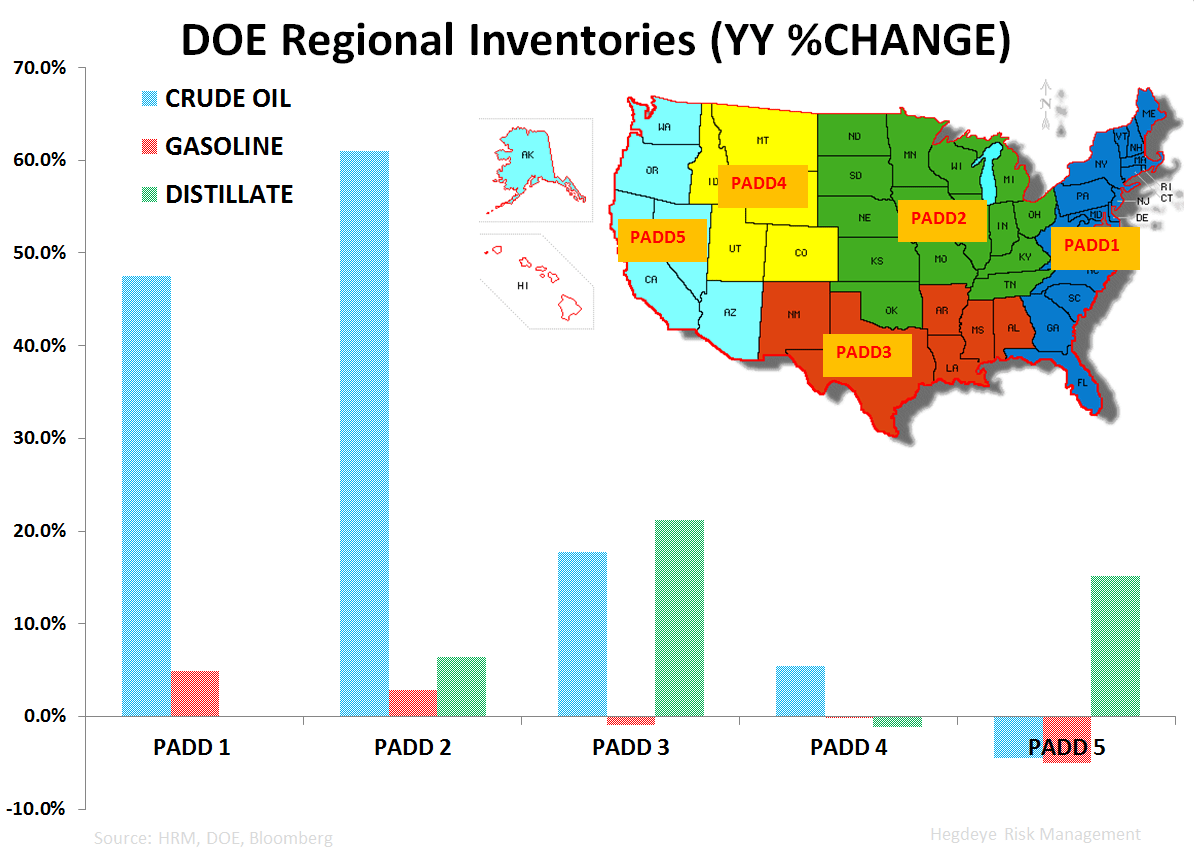


How much more crude will refineries eat up now that 1) the summer driving season is over; 2) we’re entering refinery maintenance season? Despite a big draw this week, inventories are expected to tick higher by seasonal default, but how much higher can they go anyway?
A newsy topic in the spring, the big build-up in inventories was centered on the Cushing, OK build where inventories are currently +180% Y/Y.

Refiners continue to develop more storage capacity which can’t happen fast enough:
- Aggregate working crude oil storage capacity is +2.9% Y/Y
- Tank Farm storage capacity in Cushing is +6.1% Y/Y
Even so, transportation and the light/heavy processing problems in the Gulf are stickier problems that face near term constraints.
If a seasonal inventory build commences, Cushing inventory levels have the potential to move to concerning levels again with the lack of infrastructural ability of gulf refineries to handle a continued increase in crude flows from America’s main trading hub in Cushing.
Refinery maintenance season is around the corner at the same time gulf refineries are trying to reconfigure to adequately handle the influx of tight oil (domestic shale) over traditional, heavier imported crude.
For evidence of the problem, Genscape estimates that both the Kinder Morgan Crude and Condensate Pipeline and the Eagle Ford pipeline from Eagle Ford to Houston are only running at half of nameplate capacity because of congestion inhibiting crude to bypass Houston to Louisiana refineries via pipeline. Much of it is being transported by barge and oil tankers, a much more expensive form of transportation.
A new deal like the Swap agreement with Mexico’s state-run Pemex (U.S. swaps tight oil for heavier crude capable of being processed by gulf refineries) will temporarily help the infrastructural mismatch in Houston, but the bottom line is that storage and transportation capacity constraints will creep back into the picture moving into the fall before adequate infrastructure is put in place.
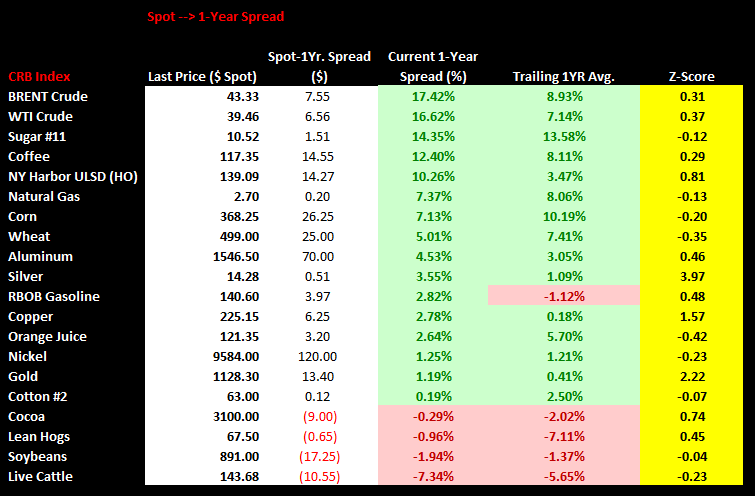
Ex. A currency catalyst to devalue the USD and support prices (which is highly possible for a brief relation trade: see our recent note), we expect deflationary macro headwinds and the fundamental supply picture domestically to continue pressuring a sustained price recovery into the fall season. The forward curve reflects this shift in psychology which usually happens the longer the "unbelievable" becomes a reality. The curve is flatter 1,2,3-years at this lower low than it was at the January and March lows in WTI.

Ben Ryan
Analyst
