


Our Hedgeye Housing Compendium table (below) aspires to present the state of the housing market in a visually-friendly format that takes about 30 seconds to consume.

Today's Focus: July Existing Home Sales & MBA Purchase Apps
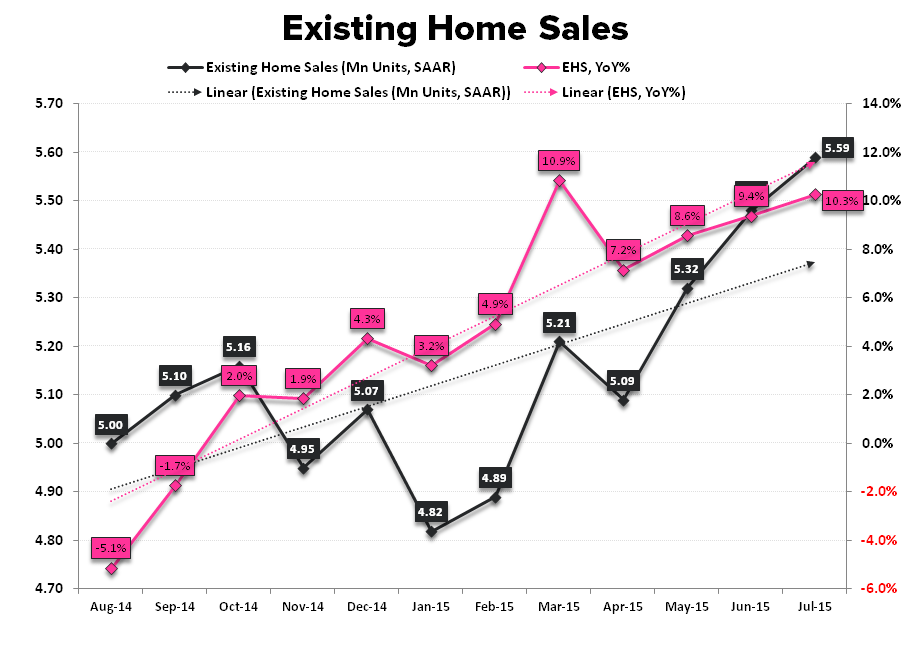
EHS in July rose +2.0% vs. downwardly revised June figures while accelerating +90 bps sequentially to +10.3% YoY as sales in the existing market made another new post-crisis high. Tight market conditions continue to support HPI with sales again growing at a premium to supply and inventory of existing homes declining on both a units and months-supply basis in the latest month
Some Considerations:
Better than Beta | When Good is Great: Asset investibility is relative and when growth gets scarce, the growth that exists gets bid. Housing’s rate-of-change transition from great to good in 3Q has proved a winner relative to the double decrement - from okay to bad - in global growth and inflation trends. Further, the recent retreat in rates – stemming largely from OUS turmoil – has further supported the relative case for domestic housing leverage over the nearer-term as affordability can tread water in the face of higher prices. Even domestically, with business investment (still) flagging and rising personal savings stymieing an acceleration in domestic consumerism, housing and resi investment sit among a select set of absolute and relative macro performers. Indeed, the shelter component of inflation which represents ~32% of the CPI basket, remains the singular source of strength buttressing the headline and core CPI readings as disinflation/deflation prevail across the preponderance of goods and services prices (see 2nd chart below).
Remember, this perfectly subjective gem of a question from the BLS anchors the CPI report and the Fed’s view of Inflation’s reality:
“If someone were to rent your home today, how much do you think it would rent for monthly, unfurnished and without utilities?”
EHS vs PHS (& Purchase Apps): The 1st chart below plots Existing and Pending Sales and, as can be seen, the recent year trend has seen EHS re-couple in favor of Pending Sales following short-term dislocations. Notably, this is the 1st month in a year in which reported EHS has eclipsed activity implied by pending sales. In prior instances, re-convergence has occurred via a retreat in EHS in the subsequent month. Further, Purchase Applications were down -2.3% MoM in July and are tracking -2.8% MoM in August. Collectively and absent a large-scale revision to the June PHS data or a surge in reported signed contract activity in July, the data suggests a balance of risk to the downside for EHS over the next month or two. We’ll get the PHS data for July next Thursday, 8/27.
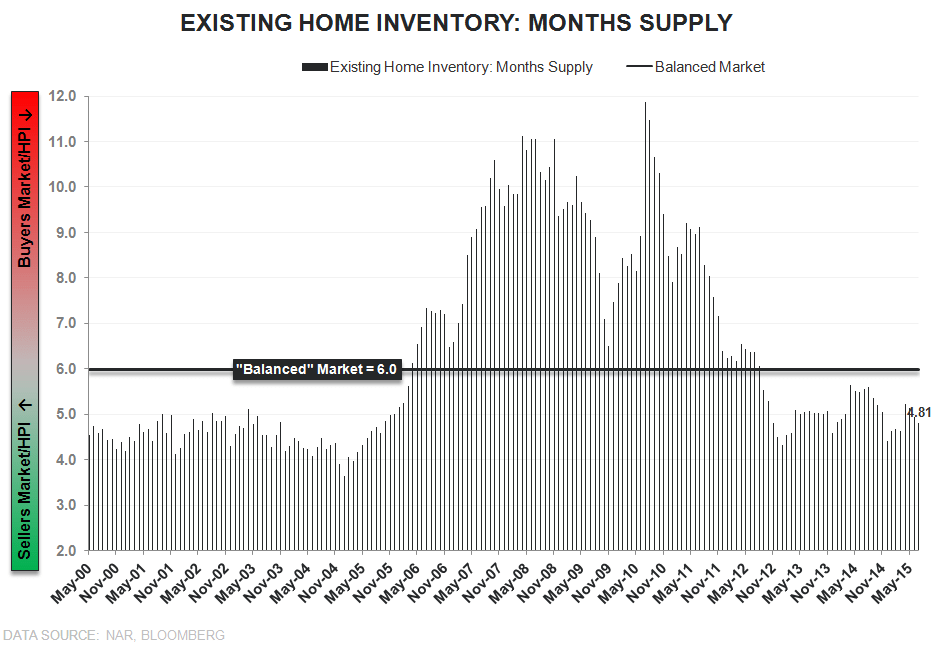
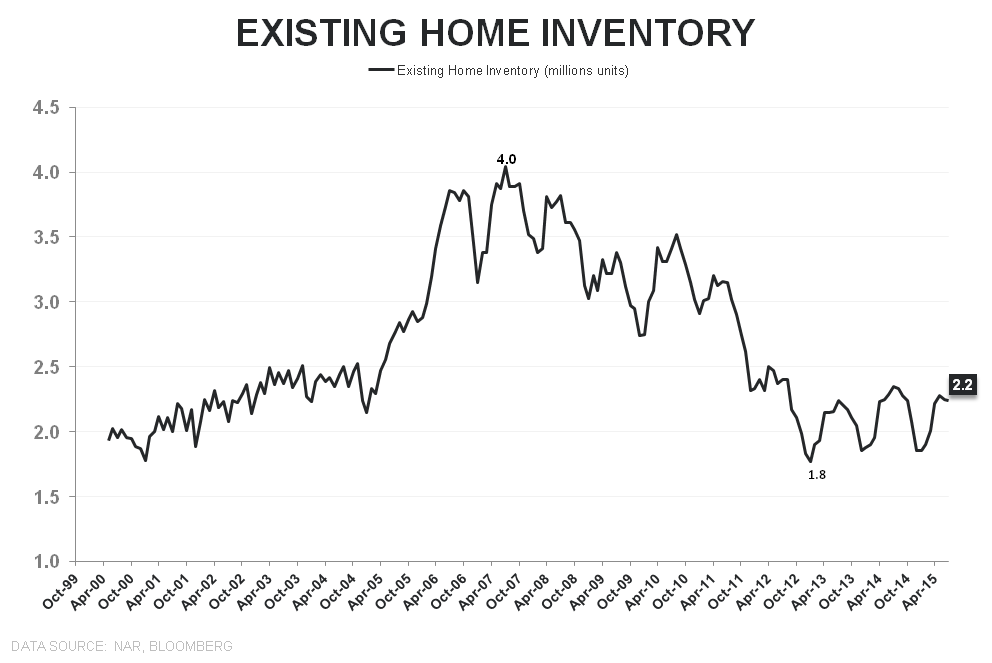
Inventory & Price: Units of inventory declined -0.4% MoM in June to 2.24 mm and with sales growing at a premium to supply for a third month, inventory on a month-supply basis dropped -2.4% to 4.81-months – representing a third month of tightening supply and the 35th month below the balanced market level of 6-months. Tight - and tightening - supply in the 90% of the market that is EHS remains supportive of improving HPI trends and the acceleration in price growth observed across the CoreLogic and FHFA price series in recent months. Again, improving 2nd derivative trends in HPI augurs positively for housing related equities given the strong contemporaneous relationship between the two.
1st-time buyers: First-time buyers represented 28% of the market in July, down from 30% in June and 29% a year ago. Sales to first-timers grew +6.5% YoY, down from +17.2% YoY and June and representing the slowest pace of growth in 9-months. The NAR posited rising prices and declining affordability as the cause of slowing 1st-time buyer demand. This likely represents a partial truth and stands at odds to their trumpeting of the return of 1st-time buyers just two months ago when their share of total hit a multi-year high of 32%. We take a trend view of the data as the month-to-month data is noisy and volatile. So long as the labor/income fundamentals continue to improve across the 20-35YOA age demographic, rising headship rates and single-family purchase demand should manifest on a moderate lag.


About Existing Home Sales:
The National Association of Realtors’ Existing Home Sales index measures the number of closed resales of homes, townhomes, condominiums, and co-ops. Existing home sales do not take into account the sale of newly constructed homes. Existing home sales account for 85-95% of all home sales (new home sales account for the remainder). Therefore, increases in existing home sales tend to signify increasing consumer confidence in the market. Additionally, Existing Home Sales is a lagging series, as it measures the closing of homes that were pending home sales between 1 and 2 months earlier.
Frequency:
The NAR’s Existing Home Sales index is published between the 20th and the 22nd of each month. The index covers data from the prior month.
About MBA Mortgage Applications:
The Mortgage Bankers’ Association’s mortgage applications index covers more than 75% of mortgage applications originated through retail and consumer direct channels. It does not include loans delivered through wholesale broker and correspondent channels. The MBA mortgage purchase applications index is considered a leading indicator of single-family home sales and construction. Moreover, it is the only housing index that is released on a weekly basis.
Frequency:
The MBA Purchase Apps index is released every Wednesday morning at 7 am EST.
Joshua Steiner, CFA
Christian B. Drake
