


Our Hedgeye Housing Compendium table (below) aspires to present the state of the housing market in a visually-friendly format that takes about 30 seconds to consume.

The last few weeks of high frequency purchase data have been largely uneventful with activity oscillating above and below the 200-level on the index.
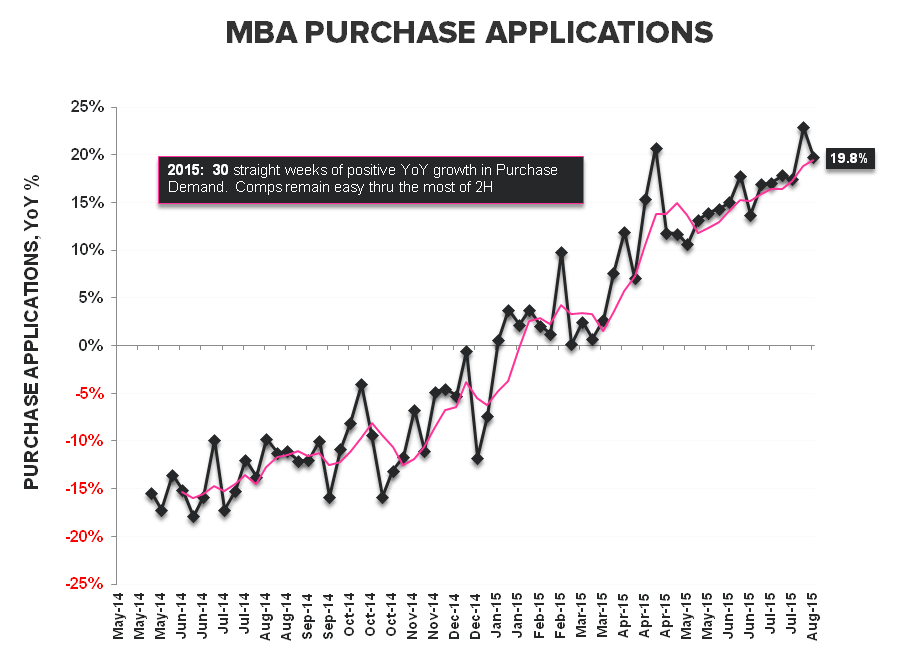
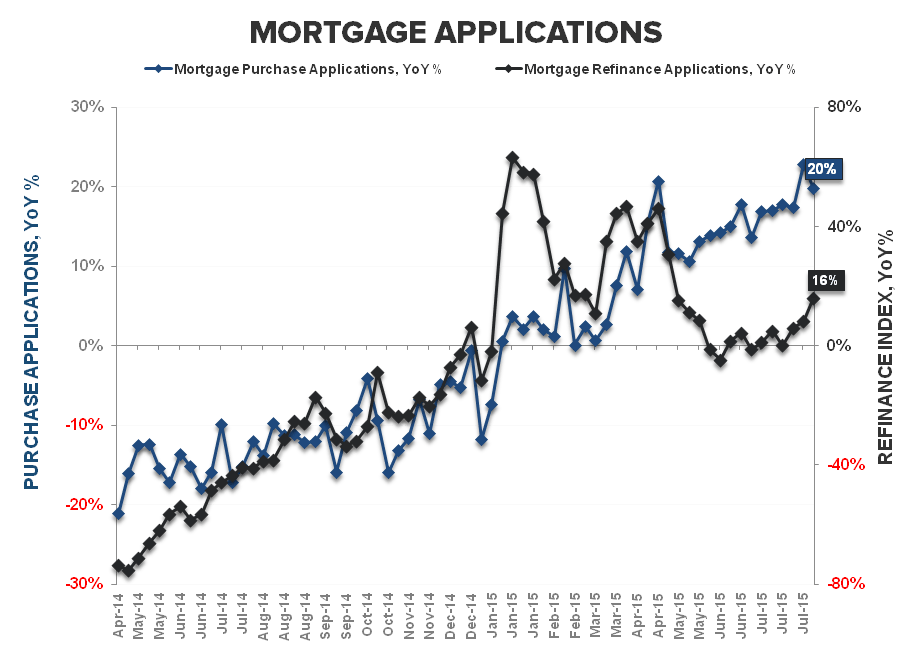
Demand Retreat: Purchase demand retraced last week’s gain, declining -3.5% WoW while decelerating -300bps sequentially to +19.8% year-over-year. On a quarter-over-quarter basis, 3Q is currently tracking down -1.1%. As we highlighted last week, the rate-of-change setup for purchase demand is showing a marginal shift.
Both sequential and year-over-year acceleration in purchase activity characterized the first half of the year, but now, with the data cresting on an absolute basis, sequential growth in 3Q is tracking negative while year-over-year growth is accelerating against trough 4Q comps.
Rate Retreat: Rates, which remain the lead ST swing factor, held flat at 4.13% in the latest week but should see downward pressure on a lag to the step function retreat in treasury yields over the past week.
Lower rates, stemming mostly from OUS turmoil can provide transient benefit.
Global Macro tumult is insidious, but usually manifests on a lag domestically so, in the nearer term, ↓rates = ↑ affordability = ↑ room for prices to rise = ↑ housing. It wasn’t particularly surprising to see Housing green yesterday alongside the decline in rates.
Boringness Retreat: In contrast to the stagnant purchase demand trend, next week’s Starts and Permits data may be more interesting.
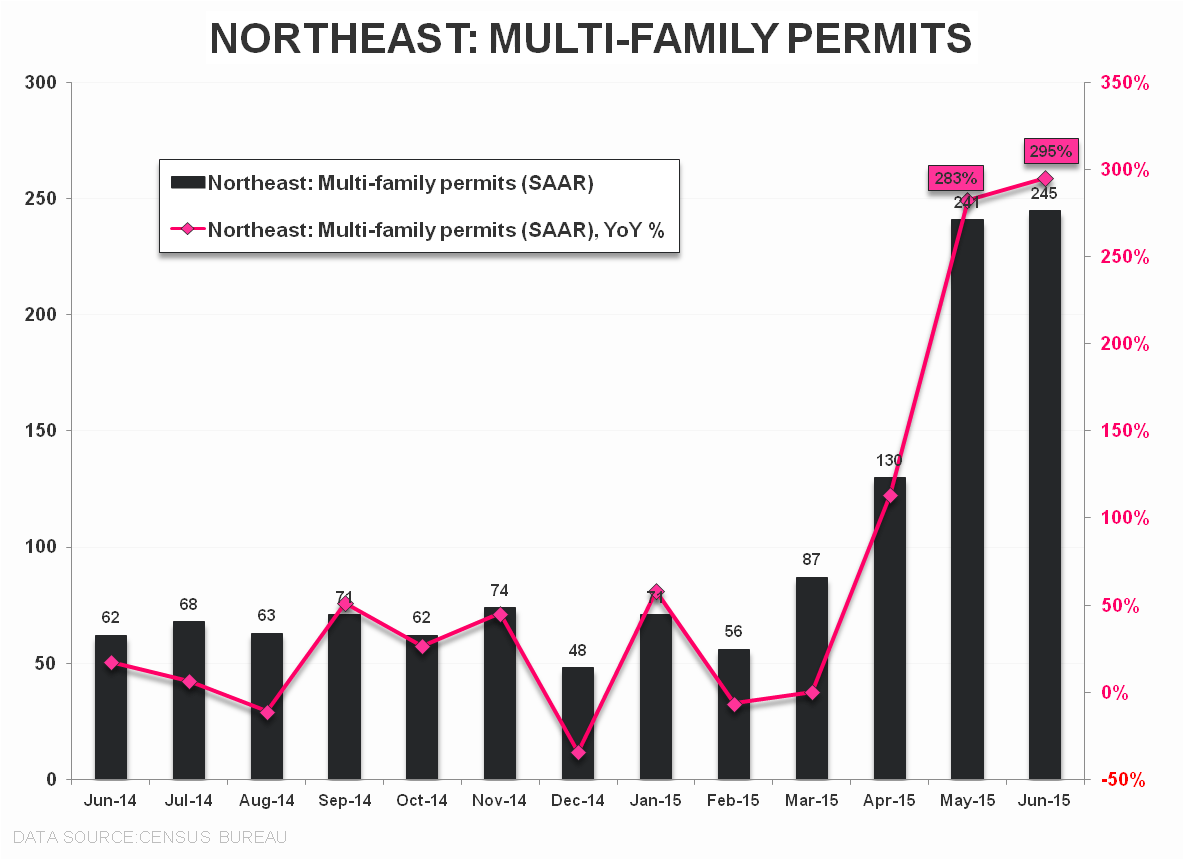
To Review: The +295% YoY growth in MF permits in the Northeast ahead of the impending NYC tax exemption expiry helped augment the Total Starts figures for a second month in June and drove MF share of total up to a 42-year high. Indeed, after rising a resounding +385% YoY in May, permits in NY state went vertical to +632% YoY in June. A reversal of that pull forward sets the stage for a retreat in the reported July data reported next tuesday. For context, a decline back to the TTM average in permits in the Northeast implies a -12-13% sequential decline, taking the total back below 1.2 MM from the post-crisis high of 1.34 MM recorded last month.
We’ve highlighted this potentiality for the last month and consensus has recently ratcheted down Permit expectations to 1217K so that idiosyncratic dynamic has seen some discounting. The risk may still to the downside but, in any case, it will be the first steep decline in housing data we’ve seen in some time.


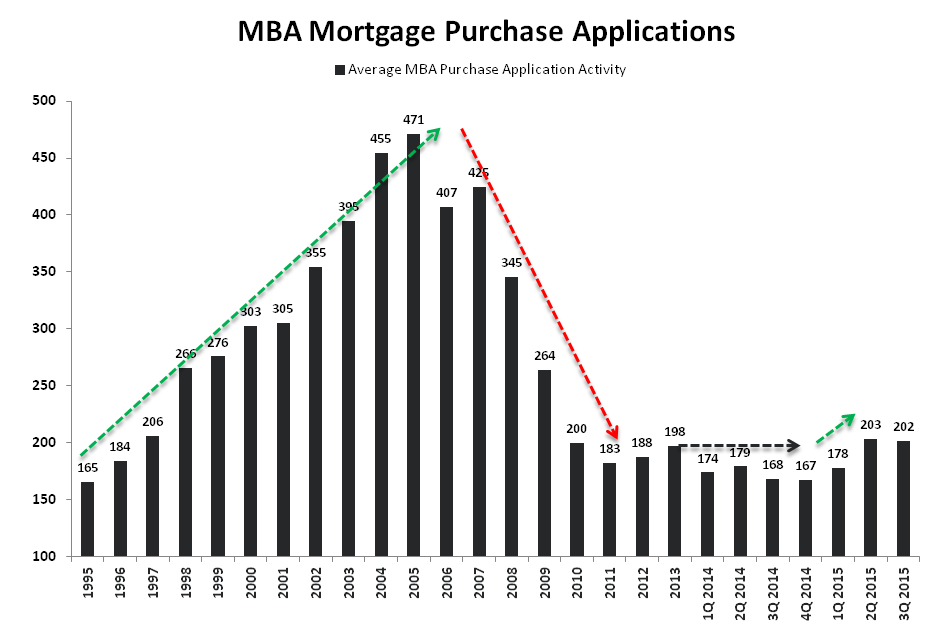

About MBA Mortgage Applications:
The Mortgage Bankers’ Association’s mortgage applications index covers more than 75% of mortgage applications originated through retail and consumer direct channels. It does not include loans delivered through wholesale broker and correspondent channels. The MBA mortgage purchase applications index is considered a leading indicator of single-family home sales and construction. Moreover, it is the only housing index that is released on a weekly basis.
Frequency:
The MBA Purchase Apps index is released every Wednesday morning at 7 am EST.
Joshua Steiner, CFA
Christian B. Drake
