


Our Hedgeye Housing Compendium table (below) aspires to present the state of the housing market in a visually-friendly format that takes about 30 seconds to consume.

With the Corelogic data in hand for about a month already, we completed the HPI trinity for September with the Case-Shiller and FHFA price series releases this morning.
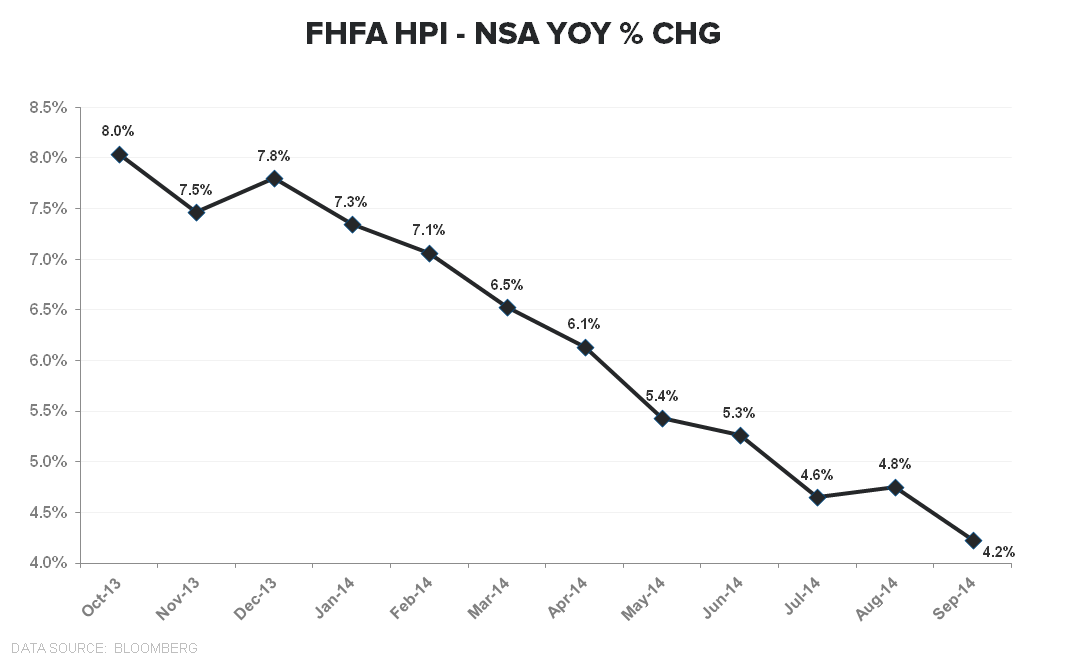
THE DATA: The Case-Shiller HPI data for September showed home prices growing +4.9% YoY, decelerating -70bps vs. +5.6% in August. Meanwhile, the FHFA series showed home prices growing at +4.2% YoY, decelerating -60bps vs the 4.8% rate of increase reported for September.
So, home price growth continues to decelerate. However, its that rate of deceleration that we’re principally concerned with.
THE DERIVATIVE: Its worth re-highlighting our base conceptual, top-down framework for housing as its been effective across cycles and centers on HPI trends:
Housing Demand leads HPI --> Home price growth follows the slope of demand on an 12-18mo lag --> Housing related equities follow the slope of home price growth
We have anchored on the 2nd derivative move in HPI trends as a key signal because, historically, equity prices across the housing complex have followed the slope in home price growth.
The 1st chart below illustrates the Equity Price-HPI relationship. The 2nd chart shows the emerging 2nd derivative stabilization in HPI trends.


We’ve seen this same cycle dynamic play out again in 2014 with housing related equities significantly underperforming alongside the ~6 months of discrete deceleration since home price growth peaked in February.
INFLECTION INSPECTION: Our tone on housing has shifted (we were explicitly bearish from Jan-Oct) in the last month as many of the negative dynamics that we flagged earlier this year have largely or completely played out.
While the macro environment remains a discrete risk to housing, (very) easy volume compares, the lapping of weather/QM Implementation/FHA loan limit reductions, looser regulation, and a fledgling stabilization in 2nd derivative HPI trends all sit as modest, prospective tailwinds for 2015.
Essentially, the balance of risk from a rate of change perspective has largely shifted.
We'll be hosting a call on December 11th to update our views on housing heading into 2015.


About Case Shiller:
The S&P/Case-Shiller Home Price Index measures the changes in value of residential real estate by tracking single-family home re-sales in 20 metropolitan areas across the US. The index uses purchase price information obtained from county assessor and recorder offices. The Case-Shiller indexes are value-weighted, meaning price trends for more expensive homes have greater influence on estimated price changes than other homes. It is vital to note that the index’s printed number is a 3-month rolling average released on a two month delay.
Frequency and Release Date:
The S&P/Case-Shiller HPI is released on the last Tuesday of every month. The index is on a two month lag and therefore does not reflect the most recent month’s home prices.
Joshua Steiner, CFA
Christian B. Drake
