

Our Hedgeye Housing Compendium table (below) aspires to present the state of the housing market in a visually-friendly format that takes about 30 seconds to consume.
*Note - to maintain cross-metric comparability, the purchase applications index shown in the table below represents the monthly average as opposed to the most recent weekly data point.

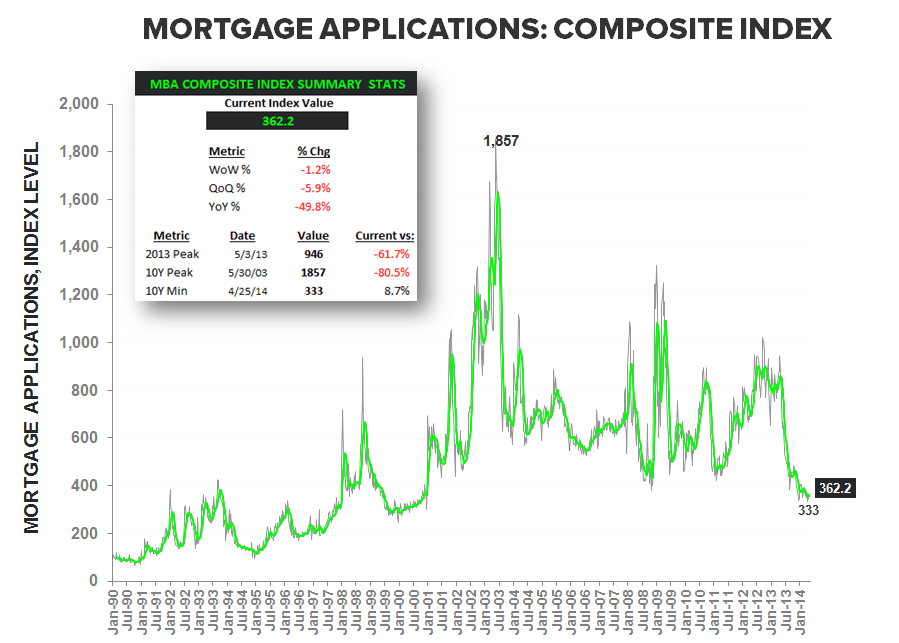
Today's Focus: MBA Mortgage Applications
The Mortgage Bankers Association today released its weekly mortgage applications survey data for the week ended May 23. Mortgage purchase application volume slid further this week dropping another -1.1% w/w. This brings the streak of negative sequential prints to three in a row on the purchase side. And while 2Q14 is tracking higher vs 1Q14 by 3.5%, it remains down year-over-year by just over -15%.
Activity cooled off on the refi side as well. After recording a few good prints (+4% w/w last week and +7% w/w in the previous week), mortgage refinance application volume was down -1.4% this past week in spite of low rates.
As a reminder, we're more interested in the mortgage purchase volume data as it's the better leading indicator of the direction of housing's momentum, while the refi data is largely a reflection of rates on a coincident basis.
Trends in housing demand tend to lead price trends by 12-18 months and, as the first chart below shows, demand recently peaked in 2Q13 and has fallen significantly since. Admittedly, 2Q14 is tracking up vs 1Q14 by 3.5%, but relative to the -19% decline since mid-2013 (and the positive shift in weather) this bounce remains quite minor.
The prevailing weakness in demand suggests that as we enter the back half of this year and the first half of 2015 we should see growing downward pressure on the rate of home price appreciation.


About MBA Mortgage Applications:
The Mortgage Bankers’ Association’s mortgage applications index covers more than 75% of mortgage applications originated through retail and consumer direct channels. It does not include loans delivered through wholesale broker and correspondent channels. The MBA mortgage purchase applications index is considered a leading indicator of single-family home sales and construction. Moreover, it is the only housing index that is released on a weekly basis.
Frequency:
The MBA Purchase Apps index is released every Wednesday morning at 7 am EST.
Joshua Steiner, CFA
Christian B. Drake
