This note was originally published at 8am on April 09, 2014 for Hedgeye subscribers.
“A good rule of thumb is that if you’ve made it to thirty-five and your job still requires you to wear a name tag, you’ve made a serious vocational error.”
-Dennis Miller
As many of you may have noticed, our research team has been busy so far this quarter adding new names to our Best Ideas list. In fact, later today we will be doing a conference outlining our short case on Yelp (ticker also YELP). No surprise, at more than 10x market cap / revenue the short call on YELP has garnered some interest because clearly if we are correct, there is valuation downside.

Tomorrow we will be going over our short case on Annie’s (ticker BNNY) and this one has also garnered a lot of interest. In fact, one prospect responded to our marketing email suggesting it was somewhat irrational to short a stock with 20% short interest. In part, he’s right as there is increased risk of a short squeeze, but more broadly his email begs the question: is it an appropriate rule of thumb to not short highly shorted stocks?
Interestingly, based on the market factors we track, highly shorted stocks definitely do not consistently outperform lower shorted ones. In fact, over the last six months, the lowest quartile of short interest stocks are up 14.4% and highest quartile of short interest stocks are only up 12.5%. Now to be fair, over other time frames, high short interest stocks have outperformed, although rarely meaningfully so.
There are also a number of studies highlighting that over time highly shorted stocks underperform. Specifically, a paper from a group of MIT professors titled, “Short interest, institutional ownership, and stock returns”, concludes:
“Stocks are short-sale constrained when there is a strong demand to sell short and limited supply of shares to borrow. Using data on both short interest (a proxy for demand) and institutional ownership (a proxy for supply) we find that constrained stocks underperform during the period 1988 – 2002 by significant 215 basis points per month on an equally weighted basis . . .”
So, the moral of the story is that you shouldn’t let “tough to short stocks” get in the way of a good short idea.
Back to the Global Macro Grind . . .
Yesterday, we held our quarterly themes call and touched upon our three key macro themes heading into Q2. These themes are #ConsumerSlowing, #HousingSlowdown, and #StructuralInflation. Rather than give you my complete rehash (you can actually listen to the replay here), I wanted to highlight a key slide and point from each section.
Clearly, with consumer discretionary stocks relatively underperforming in the year-to-date (-5% on the YTD versus utilities +9%), the #ConsumerSlowing is not new news. In this presentation, though, we truly tried to quantify the impact of commodity inflation on the median consumer by rebuilding their income statement. As it turns out, the average American consumer spends more than 20% of after tax income on food and utilities. When gas and motor oil are added to the mix, the combined total of direct commodity exposure of after tax expenditures is closer to 27%.
The average consumer also primarily generates 95% of his or her income from wages, self employment, and/or government income. In aggregate, less than 1.5% is currently sourced from interest and dividends. So, perversely, as interest rates are kept low, it constrains the average consumer from earning more income and also leads to dollar devaluation. This dollar devaluation then inflates commodity prices and squeezes the consumer from the cost side.
The second key theme of #Structuralnflation gets away slightly from the concept of commodity inflation via dollar debauchery and looks at the potential for a labor market that tightens quickly. A key reason this may happen is because businesses have been consistently under investing in both capital expenditures and employees.
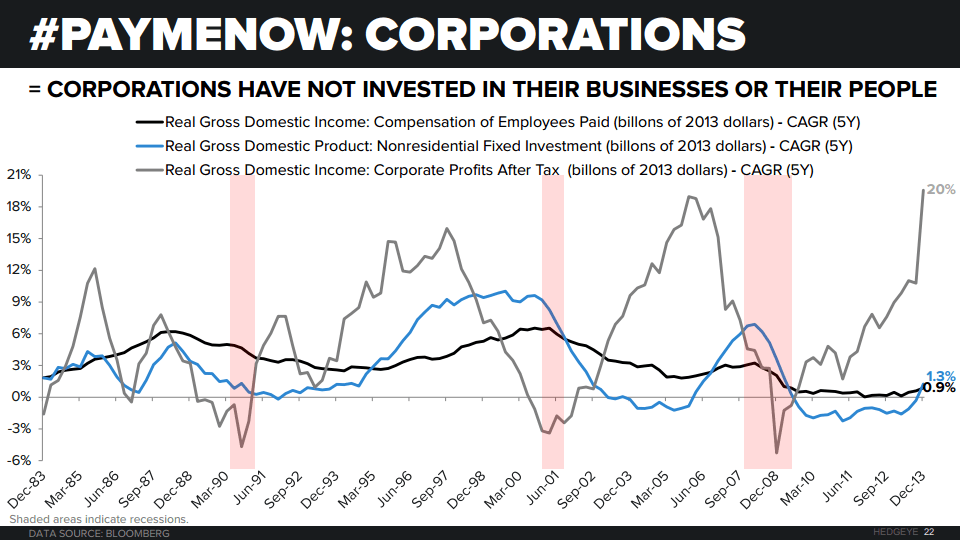
The Chart of the Day compares the year-over-year change of capital investment by businesses, compensation of employees, and corporate profits after taxes going back to 1983, so more than thirty years. As this chart shows, over time investment in infrastructure and employees largely maps with corporate profits. The exception of this is the last five years in which corporate profit growth has CAGRed at near 20%, while capital expenditures have CAGRed at +1.3% and employee compensation at +0.9%. The point being if hiring reverts to the mean it will likely be good for economic growth, but also accelerate inflation meaningfully.
The last theme for Q2 is #HousingSlowdown. This is obviously a reversal of our view for most of 2012/2013 where we were calling for acceleration in home prices. That parabolic move off the bottom is now decidedly in the rear view mirror based on our models. The most compelling support for a decline in housing demand and commensurately home prices is mortgage applications.
From the peak in April of 2013, purchase applications are down by -20%.
Further, the combination of both purchase applications and re-fi is now trending at a growth rate of -55% versus the same month a year ago. A key culprit behind this dramatic decline is the new Qualified Mortgage (QM) rules that were implemented as of January 10th.
While on one hand, more stringent underwriting rules will prevent excesses from developing, the new QM rules are also basically taking new and young home buyers out of the market. So be forewarned, the #HousingSlowdown is no illusion!
Our immediate-term Global Macro Risk Ranges are now:
UST 10yr Yield 2.64-2.75%
SPX 1830-1867
Nasdaq 4044-4203
VIX 14.11-16.62
USD 79.58-80.31
Gold 1277-1312
Keep your head up and stick on the ice,
Daryl G. Jones
Director of Research