

PERSONAL INCOME: Optically, personal income and personal disposable income growth decelerated in November. The reality is far more sanguine. Collectively, November and December of 2012 were skewed significantly by individuals pulling compensation forward ahead of the impending fiscal cliff related tax law changes.
On a 2Y basis, private sector salaries and wages are still accelerating and the drag on government sourced income stemming from federal austerity will improve against easy comps, the spending friendly budget deal, and the annualization of last year’ s tax increases.

PERSONAL SPENDING: Real personal consumption growth saw its largest MoM acceleration since February of last year as service consumption (the recent laggard) was resurgent, growth in durables was flat with trend, and Durables accelerated on a MoM, 1Y and 2Y basis. Spending grew at a premium to incomes for a second months as the savings rate dipped another 30bps to 4.2%.
While the spending numbers were strong, the MoM and YoY growth figures for November may be modestly overstated given the noisy comp dynamics – namely, any government shutdown related impact depressing October consumption and the Hurricane Sandy distortion in November of 2012.

INFLATION: Core PCE inflation came in at +1.1% YoY, still well below target. Incremental central bank hawkishness may be mildly deflationary and both food & energy cost growth is running negative in the latest CPI reading (we’d argue that’s a good thing), but labor market trends are strong, wage inflation is beginning to percolate, household credit growth went positive for the 1st time in 18 quarters in 3Q13, corporate productivity is flagging and business investment/capex spending is somewhat of a ball under water here.


SEASONALITY REMINDER: Seasonal adjustments act as a tailwind from September – February, then reverse to a headwind over the March-August period.
Shifting seasonality is perhaps most visible in the initial claims and NFP numbers but the impacts have been pervasive with the reported macro data, equity market performance, investor sentiment and analyst estimates all following a similar annual, temporal pattern. Seasonality will continue to build as a positive support through 1Q14.


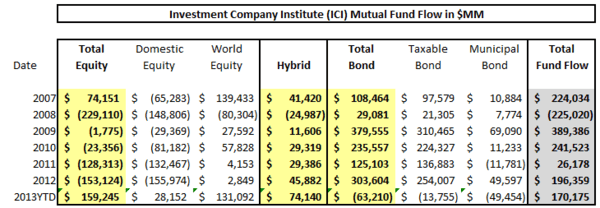
FLOWS: “Great Rotation” talk is annoyingly trite but the year-to-date tallies are hard to dismiss and existent trends look set to continue. Below we highlight the latest fund flow analysis from Jonathan Casteleyn and the Hedgeye Financials team:
- Bonds: Within mutual funds, the $1 trillion that has come into bond funds since 2008 (or the start of the Fed's quantitative easing program) has started to unwind with the first outflow in fixed income funds within the ICI data since 2007. The fixed income outflow of $63 billion through the first 49 weeks of 2013 still pales in comparison to the $303 billion inflow that came into fixed income last year in 2012 (can you say blow off top?) and also the record year of 2009 when the Great Rotation from stocks into bonds started and $379 billion came into fixed income funds. While the over $155 billion outflow in the back half of 2013 has been the sharpest bond outflow in history (most significant 27 week ouflow sequence), the first half of 2013 experienced nearly $100 billion of inflow into fixed income to net to the fairly insignificant outflow year-to-date of $63 billion so there is a case to be made that bond outflows have only just started.
- Stocks: Conversely, the nascent production in stock funds (while consistently dismissed) has been historically quite impressive being double that of the $74 billion that came into equity mutual funds in 2007. While the $159 billion running inflow into stock funds thus far in 2013 has had an international fund bend ($131 billion has gone into international stock funds versus just $28 billion into domestic equity funds), there is still ample reason to think that U.S. stocks can continue this turn in redemptions that has plagued them for all 6 years of ICI data before '13 (still record amount of cash on U.S. corporate balance sheets, generally low yields can allow stocks higher multiples, and the unwinding of the commodity super cycle and U.S. bond fund outflows needing to be invested somewhere).
(Source: Hedgeye Financials)
$USD/Yields/VIX/Equities: The Hedgeye Macro Manifesto (if there was one) posits that everything that matters in macro happens on the margin. In other words, the forecasting goal centers on divining better/worse not good/bad. In other other words, it’s all about the slope of the line.
From a GDP accounting and slope-of-the-line perspective, 3Q13 should mark the short-cycle peak in reported domestic growth. The recurrent question we’ve received over the last few weeks has been some form of “can domestic equities still work if growth slows from great to good”.
As always, our immediate/intermediate term allocation strategy will anchor on the price signal.
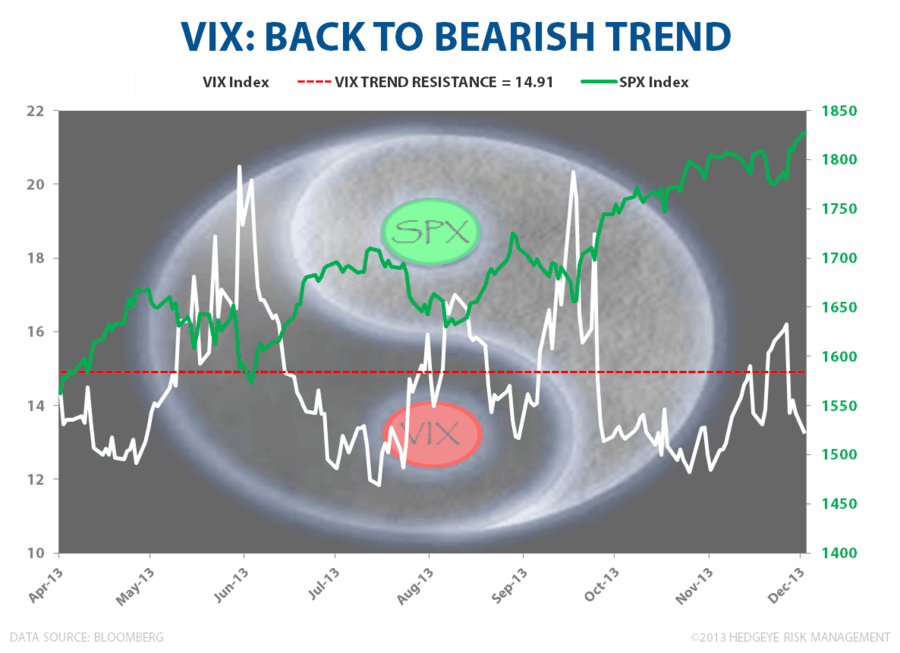
In short, if the dollar can break out above Trend Resistance at 81.13, the VIX holds below TREND resistance at 14.91, and 10Y yields can breach 2.99% (September highs) on the upside, on balance, we’ll stay on the long side of both U.S. equities and pro-growth style factor exposure.
The bond market has been been front-running the Fed all year, as have flows, and while the reallocation from credit to equities may oscillate between trickle and deluge, the broader bond outflow trend should continue alongside the northward march in rates. Further, with china stable, the Abenomics trade in full effect, and Europe following our growth path on a lag, developed markets/economies broadly should remain supportive of risk appetite in the near term.

Higher highs in equities on accelerating volume – with “flows” support, domestic and global macro fundamental support, and the lack of discrete negative, near-term catalyst - are bullish until they aren’t.
To enjoying the holiday and (still) buying the bubble,
Christian Drake
Associate
