

Canadian non-seasonally adjusted Existing Home Sales declined 3.1% y/y in April while home prices grew +2.0% according to the Teranet-National Bank 11-City composite Index – marking the 17th consecutive month of deceleration.
As a reminder, in our view of housing as a Giffen good, demand and price interact reflexively driving the self-reinforcing feedback loop characteristic of both vicious or virtuous cycles. Within this framework, the negative demand growth and sustained price deceleration currently prevailing in the Canadian housing market is not a bullish setup.
Admittedly, Canadian housing has, arguably, been overvalued for some time. With home price appreciation still positive and Canadian and global growth marching along modestly there has been no discrete catalyst for precipitating a market correction.
Now, however, with employment growth and household consumption accelerating to the downside, consumer confidence flagging, household debt ratios near peak, commodity prices deflating, and housing price growth moving towards the zero line, emergent stress in the Canadian housing market appears to be a situation worth stalking more closely on the short side.
Below we highlight the recent trends in the Canadian Housing market along with key income and balance sheets trends for Canadian Households.
Home Prices, Sales & Starts: The Teranet-National Bank Home Price Index (analogous to the Case-Shiller HPI in the USA) decelerated to +2.0% Y/Y – the 17th consecutive month of deceleration. New Housing Starts, meanwhile, continued to implode in April, declining 30.9% Y/Y. Existing Home Sales activity was also weak again in April with non-seasonally adjusted sales declining -3.1% y/y.


Canadian Housing Market Value: The first two bar charts below are from The Economist (Link) and show housing market under/over-valuation by country relative to both rental prices and disposable personal income. In rank order of overvaluation/risk, the Canadian housing market remains one of the most overvalued versus historical averages for both measures.
The third chart compares home price growth vs wages indexed back to 1999. The divergence between home prices and wages has been stark over the last 15 years with prices holding 36% downside to parity with earnings.


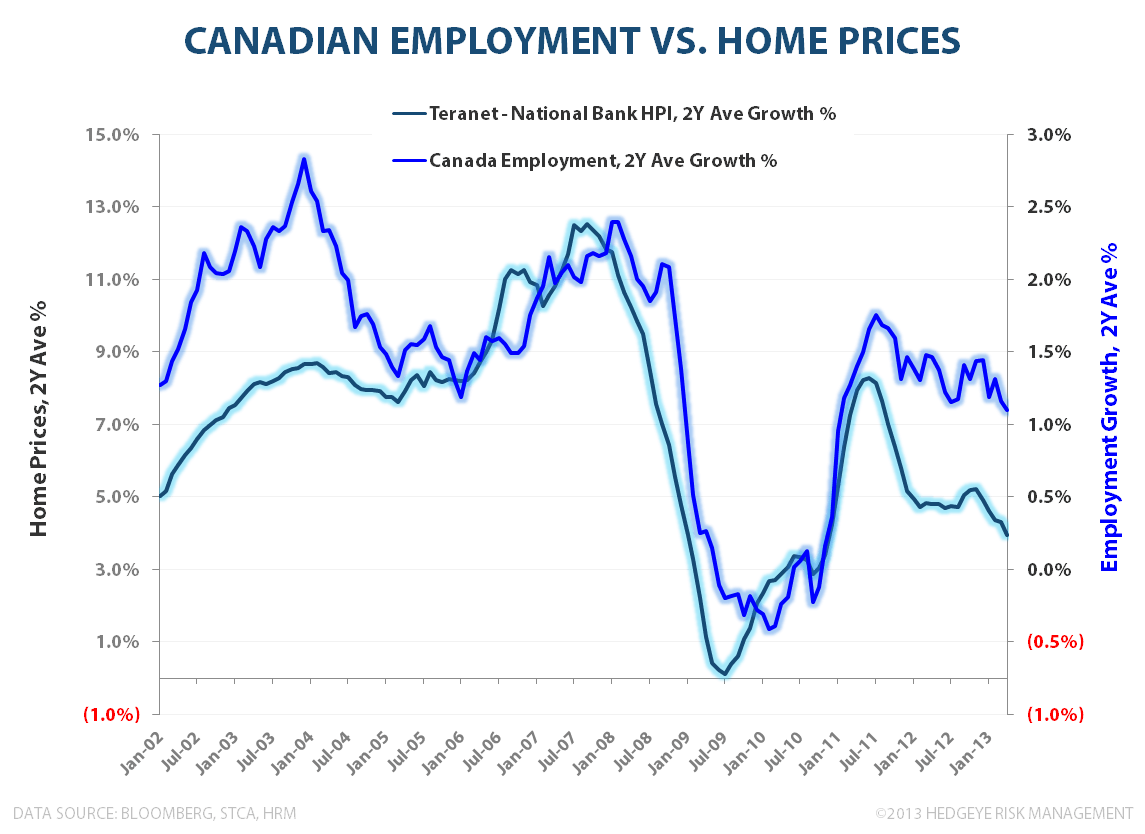
Canadian Employment: Longer-term, home prices have shown a strong relationship to labor market trends. Payroll growth decelerated to +0.9% y/y in April and the growth trend has been slowing on both a 1Y & 2Y basis. Household consumption growth has shown a similar, notable deceleration while Household debt growth continues to outpace income growth (discussed further below).

CANADA vs USA: Household Debt, Income, & Housing Downside
Current Household Debt levels look increasingly unlikely to drive incremental consumption growth or asset price inflation. Canadian Household Debt/GDP continues to rise while debt growth continues to grow at a positive spread to earnings/disposable income growth. As a comparison, below we show the longer-term Household Debt/GDP trends for both Canada and the USA.
Broadly, Canadian household debt growth is following the same trajectory as the U.S. prior to the financial crisis whereby debt growth went exponential, driving declining marginal consumption, before peaking and inflecting at 97.6% of GDP. At 91.1% of GDP as of 4Q12, Canadian household debt capacity is moving towards an upper bound and an asymmetric setup in which some manner of household deleveraging becomes increasingly likely relative to incremental, debt catalyzed consumption growth.
Indexing the Case-Shiller 20-City HPI to the Canadian home prices provides an illustration of the magnitude of peak-to-trough pricing downside for Canadian home prices from here. Using the U.S. experience as precedent, prices hold ~40% downside from current levels.


In short, the ingredients - overvalued Housing Market, slowing employment and Income growth, Household over-indebtedness, negative housing demand and decelerating price growth - are there for a housing correction or even a broader deleveraging. A move to negative price growth could serve as a trigger catalyst for a market correction as could further, significant strong-dollar driven commodity deflation for the energy/commodity-oriented Canadian economy.
In the case of negative home price growth, and from a Giffen cycle perspective, negative price growth would drive a further decline in demand in a successive, self-reinforcing fashion. On the credit side, absolute declines in home values would driver tighter lending standards, reducing the pool of qualified borrowers, serving as an additional headwind to demand and overall transaction activity.
As it relates to the commodity price deflation prevailing currently, total Canadian exports are ~$500B (on total GDP of ~$1.8T) with Energy Products, Mining/Metals, and Forestry collectively representing ~38% of total exports. If #StrongDollar continues to perpetuate broad and significant commodity deflation, the impact to the Canadian economy would not be immaterial. If this occurs concomitant to negative house price growth, slowing employment, and peak debt, it’s not a factor cocktail you’d want to be long of.
Moving forward, we’ll continue to monitor trends as we dig on the idea further. Stay tuned. It’s getting increasingly interesting here.
Christian B. Drake
Senior Analyst
