

This note was originally published October 26, 2012 at 11:23 in Macro
SUMMARY BULLETS:
- On an industry-standard C+I+G+NX (C=consumption, I=investment, G=government and NX=net exports) basis, the 3Q12 GDP report was not good. The underlying trends suggest the odds of US recession over the intermediate term are now much higher than they were a 8:29am EST.
- The unsustainable uptick in government spending ahead of the election portends quite negatively for 4Q12/1Q13 real GDP growth. Without Uncle Sam’s pre-election encroachment, 3Q12 US real GDP growth would have came in at +1.3% QoQ SAAR – or unchanged from 2Q12. If “G” actually came in at the trailing four quarter average of its contribution to GDP, 3Q12 US real GDP growth would have been a paltry +0.9% QoQ SAAR.
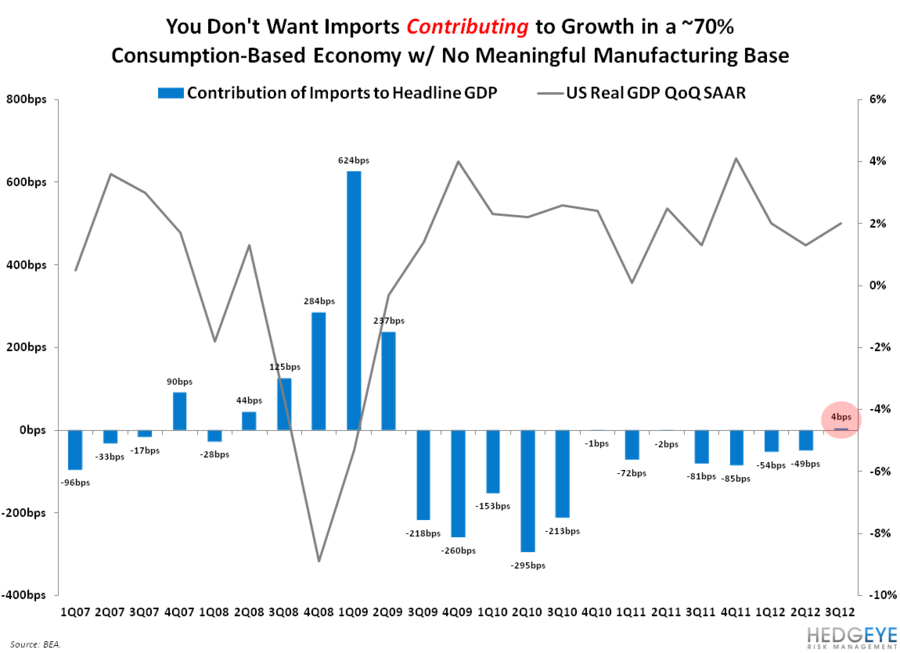
- Imports contributed +4bps to the headline GDP figure of +2% on the strength of a sequential contraction of -0.2% (down from +2.8% QoQ in 2Q12). This is the first sequential contraction of US imports since 2Q09. Importantly, the slowdown in import growth portends somewhat negatively for domestic demand trends over the intermediate term. Imports, which themselves are led by orders, lead real final sales. We’ve highlighted this relationship in previous notes (click here for more details). Is a disappointing holiday season on the horizon?
- Furthermore, the 3Q12 GDP report suggests weak imports may be leading a sequential slowdown in both “C” and “I” in the upcoming quarter(s). Additionally, an demonstrable and unsustainable acceleration in “G” was all that stood in the way of a -35% deceleration to +0.9% QoQ SAAR, allowing the headline figure to come in at +2% QoQ SAAR. This means that growth is trending along a +0.9% QoQ SAAR run rate and potentially headed lower if “C” and “I” exhibits signs of slowing.
- Unfortunately, dual slowing of “C” and “I” is indeed a probable scenario, given the uncertainty surrounding the election, fiscal cliff and debt ceiling breach. Moreover, each catalyst may actually be contributing to a noteworthy acceleration in corporate cost-cutting initiatives (layoffs?), as highlighted on 3Q earnings calls. Recessions happen when baseline GROWTH is weak, the corporate earnings cycle slows and companies start trying to cut their way into meeting peak-cycle, peak-margin forward EPS estimates. In this respect, 4Q12 is very much like 4Q07.
On a SAAR basis, US real GDP growth accelerated to +2% QoQ in 3Q12 from +1.3% in 2Q12; on a YoY basis, US real GDP growth accelerated to +2.3% in 3Q12 from +2.1% in 2Q12.
Looking beyond the headline figures, there were some rather interesting occurrences that we think are worth highlighting:
- Driven by a demonstrable acceleration in federal government spending (+9.6% QoQ in 3Q12 from -0.2% in 2Q12) the “G” in the C+I+G+NX equation contributed +71bps (or 36%) to the +2% headline figure. This was the first quarter “G” posted a positive contribution to the headline figure since 2Q10. Like the SEP Unemployment Rate and the OCT UofMich Consumer Confidence Index, the 3Q12 GDP report is just strong enough for President Obama to claim he’s got the US economy back on track just in time for the election.
- Driven by a -1.3% QoQ decline, business investment (i.e. nonresidential fixed investment) was net drag of -13bps on the headline GDP figure of +2%; this is the first time we’ve seen US businesses retrench since 1Q11, when a -1.3% QoQ contraction then contributed to a net drag of -11bps on the then-headline +0.1% QoQ SAAR figure. Uncertainty over the domestic political situation continues to contribute to slow economic growth. More on this later.
- Driven largely by drought-induced weakness in farm inventories, inventories overall contributed a -12bps drag on the headline GDP figure of +2%; this is up sequentially from -46bps. Nonfarm inventories contributed +30bps to the headline GDP figure, while farm inventories contributed a -42bps drag.
- The much-celebrated recovery in the housing market continues to auger positive for domestic real GDP growth, contributing +33bps to the headline figure in 3Q12 (up from a +19bps contribution in 2Q12) on the strength of a +14.4% QoQ growth rate (accelerated from +8.5% QoQ in 2Q12).

Given that we’re well into 4Q12 already, we think it’s worth highlighting a few nuggets from the 3Q12 report that may offer clues as to where the rate of domestic GROWTH might end up in the current and proceeding quarters:
- Imports contributed +4bps to the headline GDP figure of +2% on the strength of a sequential contraction of -0.2% (down from +2.8% QoQ in 2Q12). This is the first sequential contraction of US imports since 2Q09. Importantly, the slowdown in import growth portends somewhat negatively for domestic demand trends over the intermediate term. Imports, which themselves are led by orders, lead real final sales. We’ve highlighted this relationship in previous notes (click here for more details). Is a disappointing holiday season on the horizon?
- The unsustainable uptick in government spending ahead of the election – as great as it may be for the Keynesian elite – actually portends quite negatively for 4Q12/1Q13 real GDP growth. Without Uncle Sam’s pre-election encroachment, 3Q12 US real GDP growth would have came in at +1.3% QoQ SAAR – or unchanged from 2Q12. If “G” actually came in at the trailing four quarter average of its contribution to GDP, 3Q12 US real GDP growth would have been a paltry +0.9% QoQ SAAR. Imagine if three months from now, US real GDP slowed from +2% QoQ SAAR in 3Q12 to +0.9% QoQ SAAR (or lower) in 4Q12. That is a real risk.
Net-net, the 3Q12 GDP report suggests weak imports may be leading a sequential slowdown in both “C” and “I” in the upcoming quarter(s). Additionally, an demonstrable and unsustainable acceleration in “G” was all that stood in the way of a -35% deceleration to +0.9% QoQ SAAR, allowing the headline figure to come in at +2% QoQ SAAR. This means that growth is trending along a +0.9% QoQ SAAR run rate and potentially headed lower if “C” and “I” exhibits signs of slowing.
Unfortunately, dual slowing of “C” and “I” is indeed a probable scenario, given the uncertainty surrounding the election, fiscal cliff and debt ceiling breach. Moreover, each catalyst may actually be contributing to a noteworthy acceleration in corporate cost-cutting initiatives (layoffs?), as highlighted on 3Q earnings calls. Recessions happen when baseline GROWTH is weak, the corporate earnings cycle slows and companies start trying to cut their way into meeting peak-cycle, peak-margin forward EPS estimates. In this respect, 4Q12 is very much like its 2007 counterpart.
Our updated US GIP model is included in the chart below.
Darius Dale
Senior Analyst

