“Defense is superior to opulence.”
-Adam Smith
Stock market bulls pulled out all of their guns yesterday. From the Fed’s James Bullard beating his chest on the potential for QG3, to the Saudis banging out barrels of oil, and the media professing that the Libyan nut-job had been shot – it was all out there. Central Planners of the world unite!
Yes, it’s sad – but it’s true. The other side of the Big Government Intervention trade has been price volatility. What can the Almighty Government do for us next? Price “stability” mandate of the Federal Reserve Act of 1913 be damned. This casino is open for business.
Can US stock market bulls handle three consecutive down days anymore? The Europeans were amazingly able to stomach four. After a 3-day -2.8% drop from this intermediate-term cycle’s closing high in the SP500 of 1343, the question remains – can the bulls defend their critical support lines?
Government Supports in this market are crystal clear: immediately after the St Louis Fed dove opened his mouth, the US Dollar got Bullarded (new wiki synonym for debauched). At the same time the Saudis predictably defended their Kingdom.
Quantitative Supports are less clear: with so many of Wall Street’s finest still using the 50 and 200 day moving averages as their point and click concepts of revisionist risk management, it’s become both entertaining and frightening to watch. The bulls panic when there’s such a big gap between last price the and nearest one-factor price momentum reference point (the 50-day for the SP500 is down at 1287).
I used to do that – trade on emotion. When I was in college, someone invented the internet. And I was immediately able to punch a moving average into a chart. Then I started doing it with lots of charts. Then I started trading and realized by 2001 that I needed a lot of beers to convince myself that a simple moving average was going to be the elixir of my stock picking life.
I wrote about a basic 3-factor setup that I use in my multi-factor, multi-duration, risk management model earlier this week – PRICE, VOLUME, and VOLATILITY. So rather than attempting to make any more average-at-best jokes in a Friday note, I’ll just get on with it and show you some immediate-term TRADE lines of support and resistance.
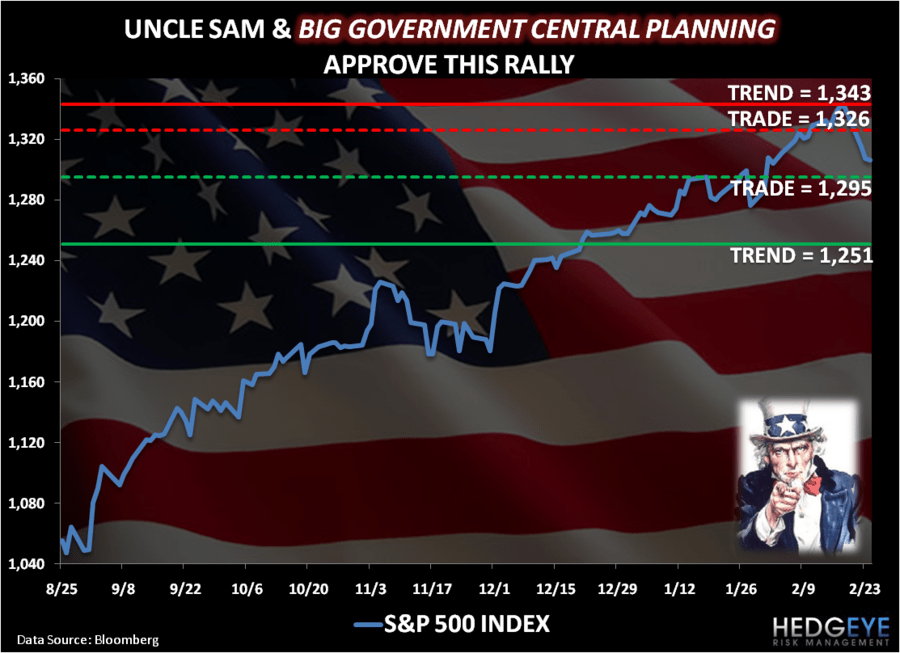
SP500 (see attached chart)
- TRADE line resistance = 1326 (that’s both a lower long-term and lower immediate-term high)
- TRADE line support = 1295
Volatility (VIX)
- TRADE line resistance = 22.96
- TRADE line support = 18.14
The inverse correlation between the SP500 and the VIX is a critical one to consider when mapping out the probability of the US stock market holding onto its bullish intermediate-term TREND. What’s most interesting about the current setup is that when you expand your duration to 3 months-or-more (our TREND duration) as opposed to 3 weeks-or-less (our TRADE duration), both the SP500 and the VIX are bullishly positioned. One of the two has got to give.
Here are those two critical intermediate-term TREND lines of support:
- SP500 = 1251
- VIX = 18.11
For now, the better benefit of the doubt should be given to the stock market bulls. With the SP500 still up +93.2% from where we got bullish on US Equities in March of 2009, a tremendous amount of price momentum has been baked into this bullish cake.
Additionally, the immediate-term move in Big Government Sponsored Volatility (VIX) has been surreal (the VIX is UP +37% since February the 11th!). And most 3.5-4.5 standard deviation moves in price (oil just had one too) are subject to immediate-term mean reversion corrections.
All that said, the coming days will be critical to monitor from a PRICE, VOLUME, and VOLATILITY perspective. The fundamental Global Macro overlay of Growth Slowing as Inflation Accelerates will also be key to measure in real-time.
Most Asian and Emerging stock markets are already broken on both our TRADE and TREND durations. Concurrent VOLUME and VOLATILITY signals continue to support the bearish case for our short positions from Emerging Markets (EEM) to Brazil (EWZ).
Here at home, I maintain that the Superior Defense for America’s long-term prosperity is defending the US Dollar rather than debauching it. I want to stand alongside the brave men and women wearing Canadian and American jerseys who recognize that the names on the front of our jerseys mean more than the ones on our backs (Herb Brooks). It’s time to stop begging for Saudi barrels and Quantitative Guessing. It’s time to stand up and be accountable.
My immediate term support and resistance lines for the SP500 are 1295 and 1326, respectively.
Best of luck out there today,
KM
Keith R. McCullough
Chief Executive Officer