Below is a chart and brief excerpt from today's Early Look written by Director of Research Daryl Jones.
|
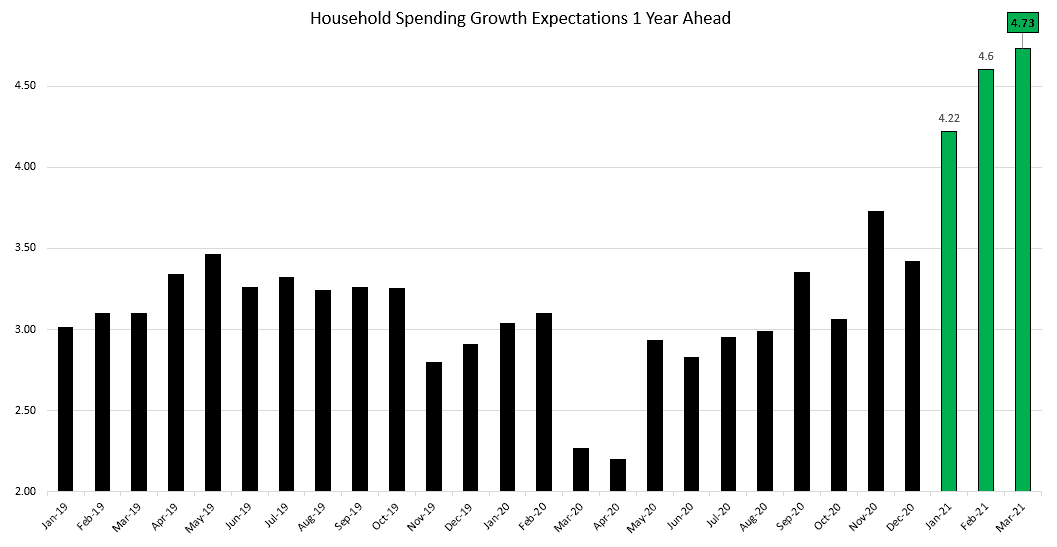
In the chart of the day, I’ve highlighted Household Growth Spending expectations 1-year ahead. This is a classic #Quad2 chart showing both year-over-year and sequential increases. The fact that expectations of household spending are at/near all-time levels shouldn’t be a surprise as stimmies get received, savings go up, employment and aggregate wage income accelerate, and revolving/credit card debt makes new lows. The question as always is when does this accelerating economic data peak and roll over, we don’t have a strong view on that yet. But rest assured we will be measuring and mapping it daily, but for now business and consumer confidence is strong and accelerating. And as Vince Lombardi famously said: “Confidence is contagious. So is lack of confidence.” |