Improvement in Single Family Housing Starts Leads Improvement in Unemployment
The folks at Calculated Risk (calculatedriskblog.com) showed an interesting chart yesterday of Single Family Starts versus unemployment. We’ve recreated this chart below. As you can see, an improvement in single family starts typically leads an improvement in unemployment by 12-18 months. (The 2001 recession was an exception.) Single family starts have not been improving in recent months; rather, following the expiration of the tax credit, they’ve trended sharply downward. This suggests that we are not in for a swift improvement in unemployment from here – in fact, the downward move suggests that unemployment could increase on a reported basis (though clearly the labor force participation rate is affecting the unemployment print, as we demonstrated two weeks ago).

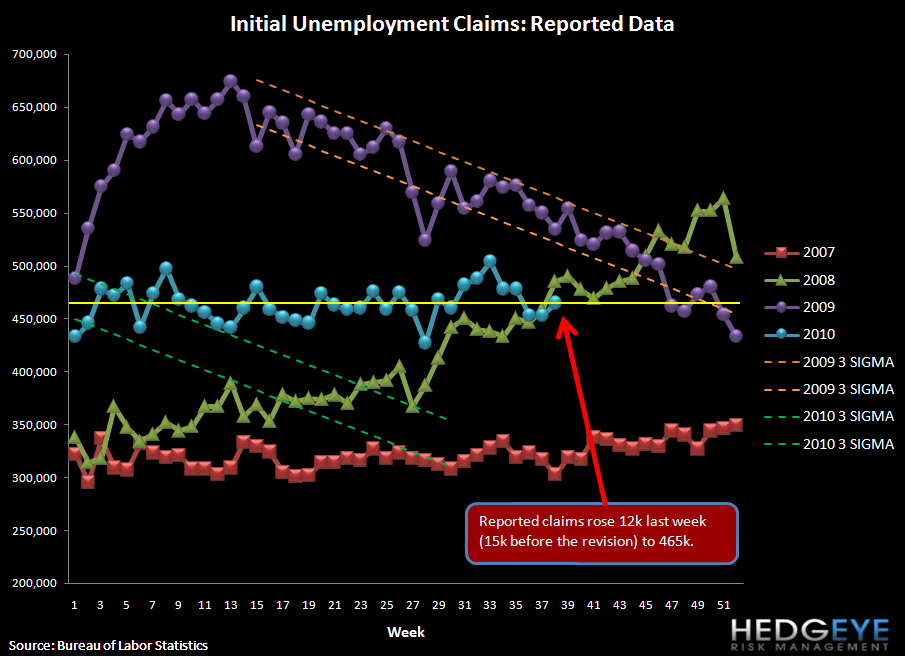
Initial Claims Climb
Initial claims rose 12k last week to 465k (rising 15k before the revision). Rolling claims came in at 462.25k, a decline of 3.25k over the previous week. Reported claims climbed back toward the middle of the range of 450-470k that the series has occupied for all of 2010. While the rolling claims number was incrementally bullish, we are still looking for initial claims in the 375-400k range before unemployment meaningfully improves.

Our firm's expectations for an ongoing economic slowdown relative to the first half of the year will keep a lid on new hiring activity as management teams focus on cost control. All of this raises the risks that a prospective slowdown in GDP will precipitate an incremental slowdown in hiring/pickup in firings, which will, in turn, further pressure growth. We continue to look to claims as the best indicator for the job market, as they are real time and inflections in the series have signaled important turning points in the market in the past.
Yield Curve
The following chart shows 2-10 spread by quarter while the chart below that shows the sequential change. The 2-10 spread (a proxy for NIM) has been under significant pressure in the past two quarters. Yesterday’s closing value of 212 bps is down from 224 bps last week.


The table below shows the stock performance of each Financial subsector over four durations.

Census headwinds should abate at the end of September, as this is the last month in which Census has historically been a drag.

Joshua Steiner, CFA
Allison Kaptur
