The CHART OF THE DAY below stands behind my 14th bearish point of the day and should illicit plenty of questions in any risk managers mind about go forward US growth expectations. US industrial production “comps” only get tougher from here – that doesn’t mean we are calling for a newsy “double dip” (which implies negative Q3/Q4 US GDP growth), but it definitely suggests US GDP growth can continue to drop sequentially for the next 3-6 months.
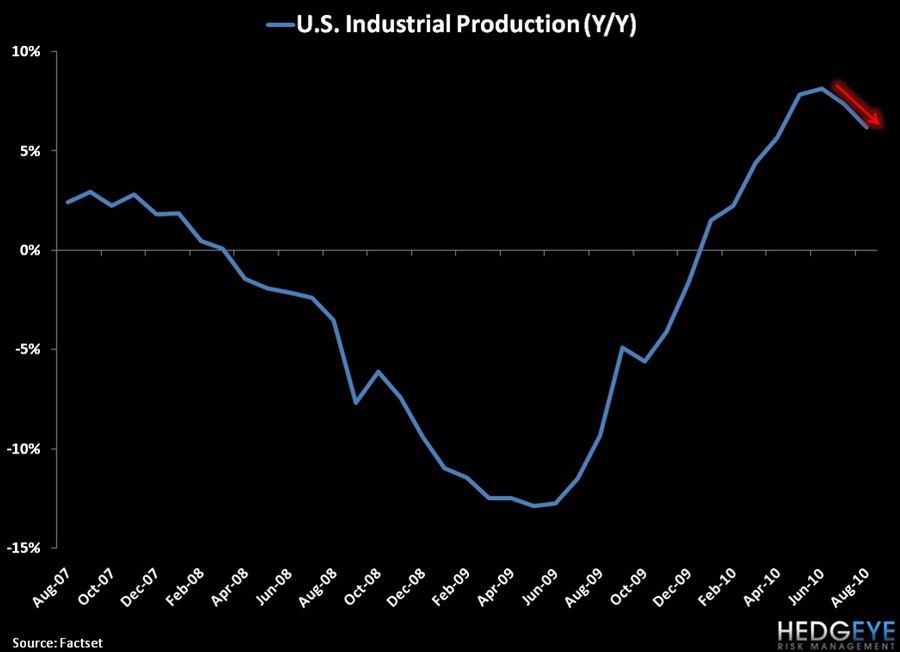
I’ll leave you alone with that red arrow to noodle over for today.
KM
All notes posted in the unlocked research section are posted on delay. Subscribe to receive our research and portfolio ideas in real-time.