With the current administration playing defense ahead of midterms in November, a positive bias to the jobs picture is all but assured as we head into the elections. To be clear, the fudging of government data happens whatever party is in the ascendency, but politics will play a particularly significant role in government-reported statistics over the next few months. This is the reality for GDP, inflation, and jobs.
This point has been made by various sources over the past few days but I think it speaks further to the theme of opacity, if not outright bias, in government numbers that we have been highlighting ad nauseum.
There are two ways (maybe more) the government can manipulate the jobs data to make things look better than they appear. The first way was highlighted in a post entitled, “FRIDAY MACRO MIXER: THE PAYROLL FUDGE FACTOR”, I discussed the implications of the Birth/Death model on the credibility (or lack thereof) of the payroll data. As I wrote on Friday, the last benchmark revision released by the BLS indicated that the Birth/Death model numbers were grossly understating job losses and, as such, is not reliable.
The second way the BLS distorts the numbers is through the headline unemployment rate, which is being deflated by changes in the Labor Force Participation Rate.
Since BLS unemployment data begins, 1948, the proportion of the civilian population working or seeking work has generally been growing. This is largely as a result of women entering the workplace and long-term growth in the U.S. economy through the 20th century. The 1950’s saw year over year increases in the labor force participation rate of 210 bps – more than three standard deviations from the mean of all available data (January 1948 to present). Recently, there has been a period of precipitous decline in labor force participation rate, peaking at a year-over-year decline of 120 bps – two standard deviations from the mean – which is important to note.
The chart below details where the unemployment rate would be if the labor force participation rate was at its ten-year average level of 66.1%; for the year-to-date, it has been averaging 64.8%. This implies that many folks are losing heart and dropping out of the job hunt.

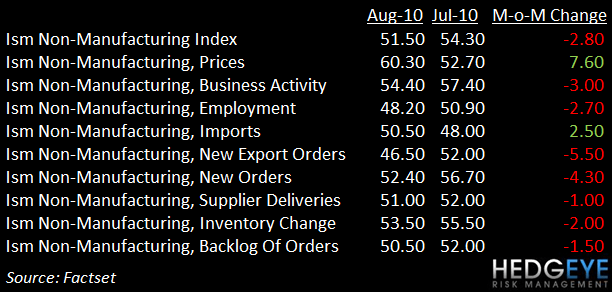
An early indication the surprisingly positive labor market report from last week will not continue. The ISM purchasing managers nonmanufacturing (services) survey for August showed a plunge in its employment component. As seen in the chart below.
With the November elections right around the corner, the “spin” from both parties will reach fever pitch. With respect to government data, we expect the numbers to remain close to consensus ahead of midterms.
Howard Penney
Managing Director
