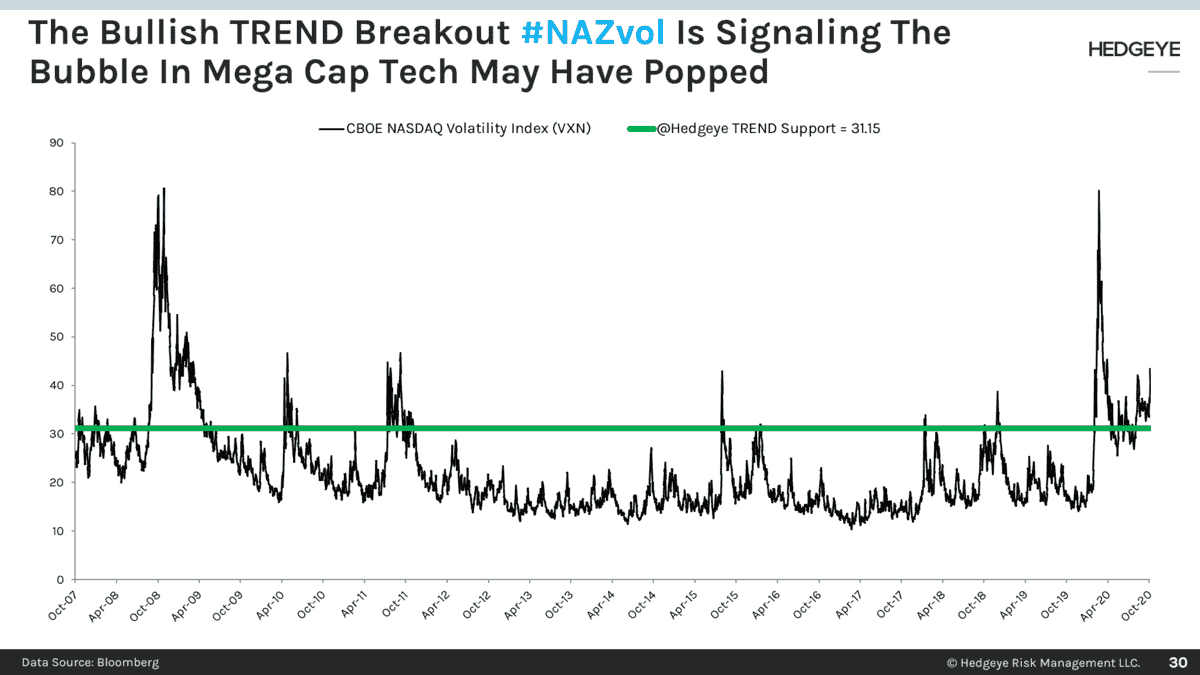
Below is a chart and brief excerpt from today's Early Look written by Hedgeye CEO Keith McCullough.
|
#Decelerating Volume into the political event? Yep. I didn’t tell volume or cross-asset-class volatility to do what it did yesterday. It had nothing to do with my political opinion of Pump either. It did what it did – and it’s all part of The Setup: A) Total US Equity Market Volume #decelerated -14% vs. it’s 1-month average yesterday It’s a good thing no one is long Mega Cap Bubbles ahead of this election. It’s all supposed to be awesome for everyone, no? C’mon. Let’s not hope for our positions to work – let’s work with the positions that are working. If there’s one major mistake most people running OPM (other people’s money) or their own money make it’s that they SELL winners too early and always AVERAGE into losers. Simplistically speaking, doing that over time makes you a loser. |