Jobless Claims Hit 500k
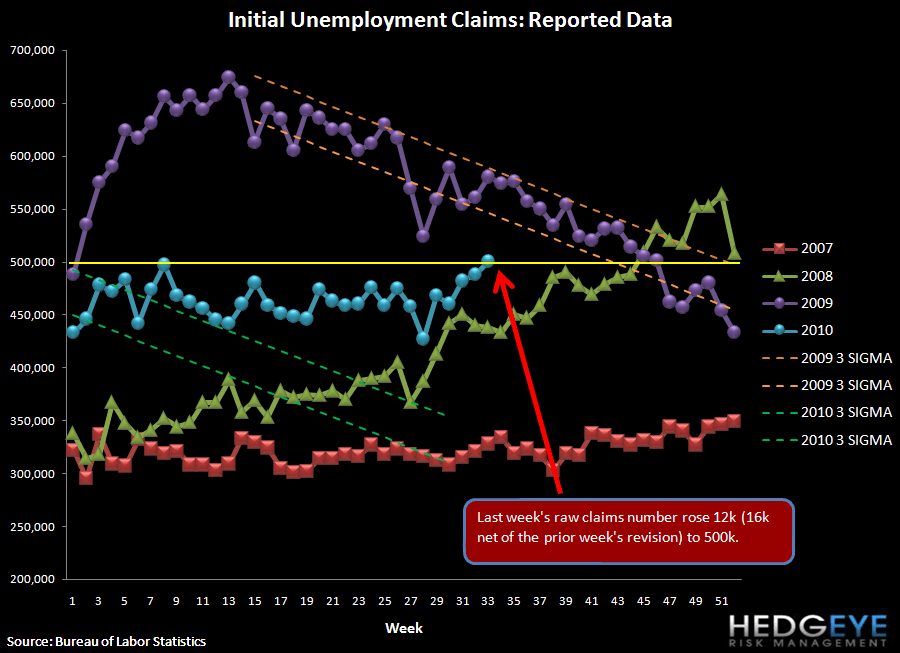
Initial jobless claims rose 12k last week to 500k, the highest level since November 2009. Consensus had called for a small decline. Rolling claims rose 8k to 482.5k, also the highest level since last November. We have been looking for the range of 375-400k as the maximum level for unemployment to fall meaningfully, but with claims moving the wrong direction, the spectre of rising unemployment looms.
To reiterate, our firm is of the strong view that US economic growth is going to slow markedly in the back half of this year and into 2011. We think this will keep a lid on new hiring activity and will keep cost rationalization paramount in the minds of C-suite executives. All of this raises the risks that a prospective slowdown in GDP will precipitate an incremental slowdown in hiring/pickup in firings, which will, in turn, further pressure growth. We continue to look to claims as the best indicator for the job market, as they are real time and inflections in the series have signaled important turning points in the market in the past.

2-10 Spread Compresses Further
The following chart shows 2-10 spread by quarter while the chart below that shows the sequential change. The 2-10 spread (a proxy for NIM) has been collapsing in the past two quarters. The current value of 214 bps compares to 217 last week.


The table below shows the stock performance of each Financial subsector over four durations.
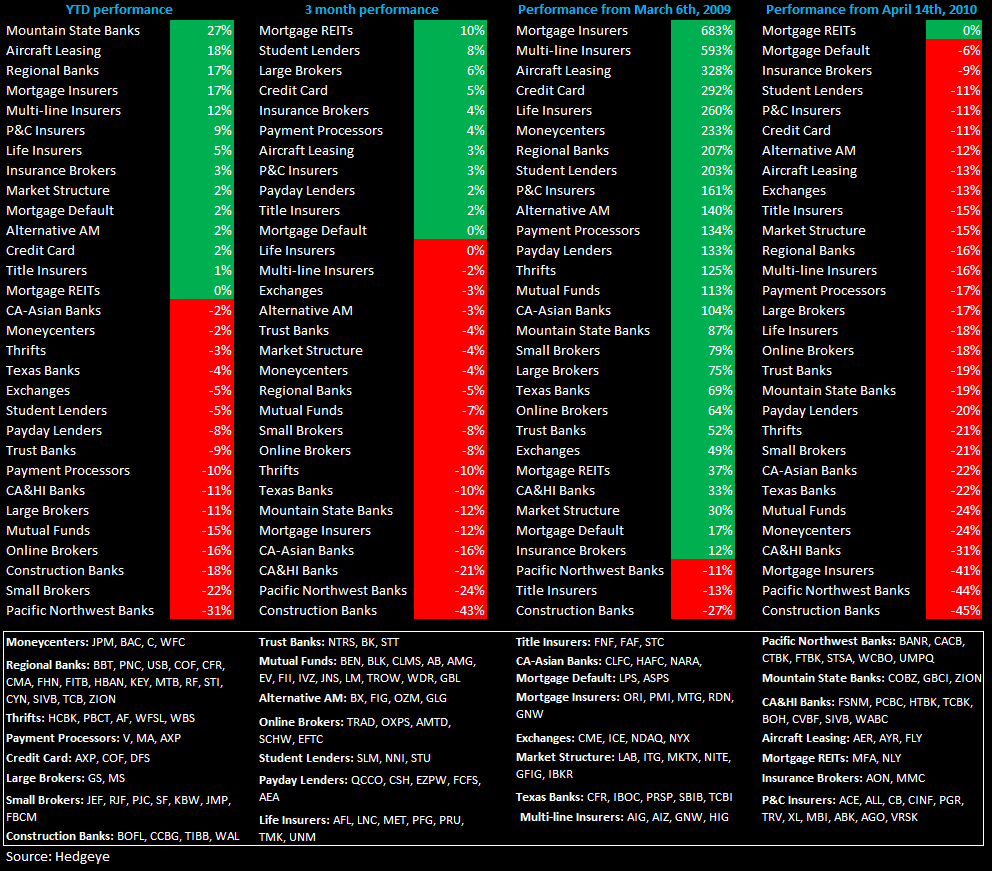
Below we show the correlations between initial claims and each of the 30 Financial Subsectors. We have refreshed this table to reflect prices through the end of July. Using this updated measure, Credit Card and Payment Processing companies remain the most correlated to initial claims, with R-squared values of .63 and .65 over the last year, respectively. Surprisingly, some subsectors show a positive correlation coefficient to initial claims - i.e. Financials that go up as unemployment claims go up. These names are concentrated in the Pacific Northwest Banks and Construction Banks, though these correlations are usually not very high.

Astute investors will note that in some cases the R-squared doesn't seem to reconcile with the square of the correlation coefficient. This is a result of finding the correlation and then averaging. For example, Pacific Northwest Banks have an average correlation coefficient of .33 and an average R-squared of .52 (with CACB, CTBK, FTBK, and STSA strongly positively correlated and UMPQ strongly negatively correlated). The different directions have the effect of canceling out each other out when finding the average correlation coefficient, but do not cancel out when finding the average R-squared.
The following table shows the most highly correlated stocks (both positively and negatively correlated) with initial claims. Note that the top 15 negatively correlated stocks have a much stronger correlation on average than the top 15 positively correlated stocks - as you would expect, given that most of the Financial space is pro-cyclical.

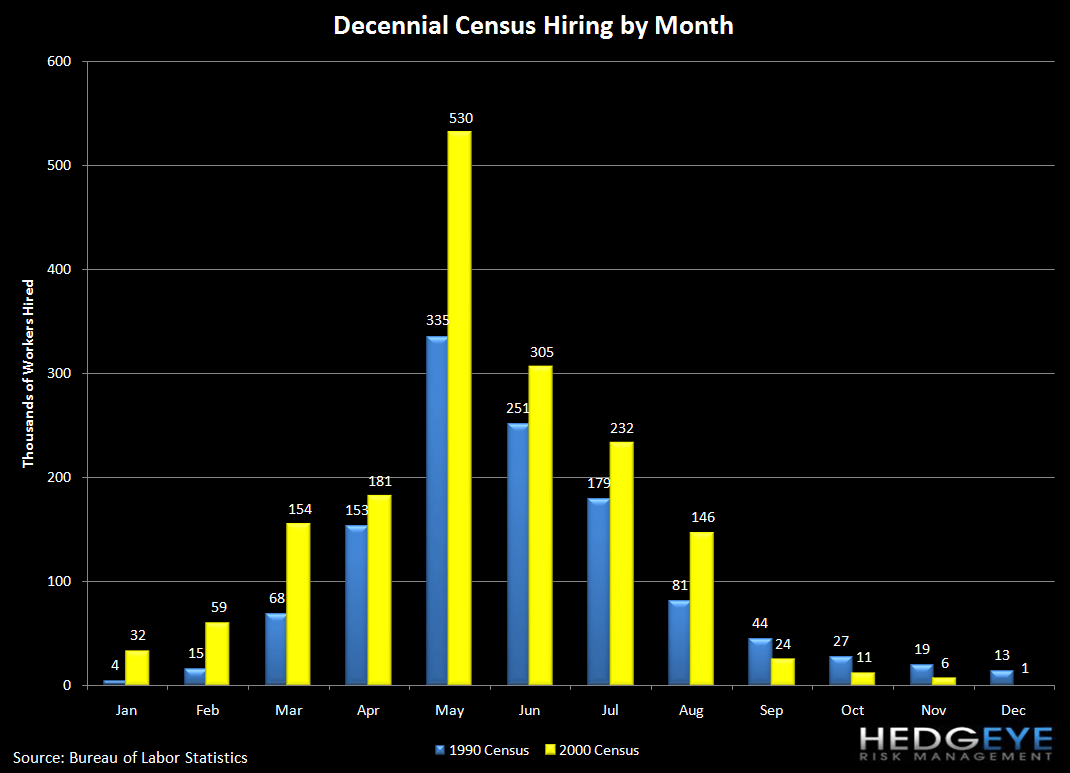
As a reminder, May was the peak month of Census hiring, and it should now be a headwind through September as the Census continues to wind down.
Joshua Steiner, CFA
Allison Kaptur
