This morning’s data offered an interesting juxtaposition for our burgeoning K-shaped reality.
The Retail Sales data (below) flashed some upside, helping to assuage acute concerns around an imminent turn for the terminal vis-à-vis the domestic consumer. For the more cynical, it could also be framed as proving that if you just give people a bunch of money, they will buy some stuff …. implicit in that is the notion that the converse also holds and commerce will roll-over as any residual impacts of stimulus/enhanced benefits fade.
Anyway, it turns out that if there’s not that much for people to do – owing to a protracted suppression in activity associated with the largest (& ongoing) global macro shock in a century - people will do less stuff.
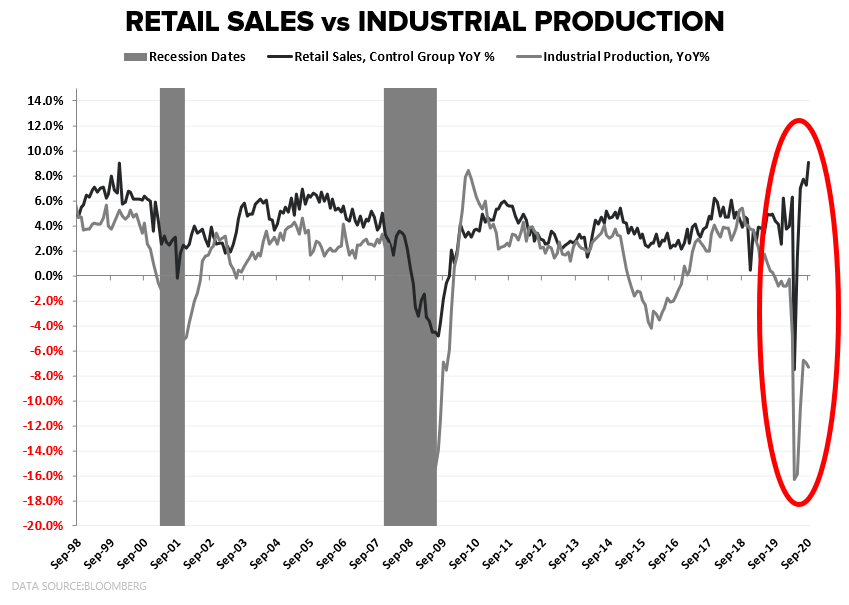
Industrial Production returned to negative sequential growth in September, falling -0.63% M/M while slowing to -7.28% Y/Y – marking a 2nd month of acceleration to the downside and the 13th consecutive month of negative Y/Y growth.
Utility production fell -5.6% due to lower air conditioning use and served as a drag but the weakness was broad based with Manufacturing Production down -0.3% M/M and -6% Y/Y and Capacity Utilization falling from already depressed levels.
In short, the domestic industrial deceleration pre-dates the pandemic and the post-lockdown rebound in both Production and Capacity Utilization increasingly appears to be stalling at meaningfully depressed levels. And depressed demand and rampant excess capacity (obviously) don't argue for resurgent capex, large-scale hiring or and imminent turn in the inflationary tide, at least not emanating from the domestic industrial complex.
For a populous with a proclivity for reality distortion existing in an era of ubiquitous connectivity, social isolation and digital echo chambers, the K-shaped evolution in the data also serves to further enable the production of expertly crafted narrative nonsense.
The same nested nonsense that supports the kind of diametric position that we have the strongest economy ever (Retail Sales) while, simultaneously, arguing that we are also in acute need of $2T+ in incremental stimulus (Industrial Production).
But it’s Friday, and I digress …..


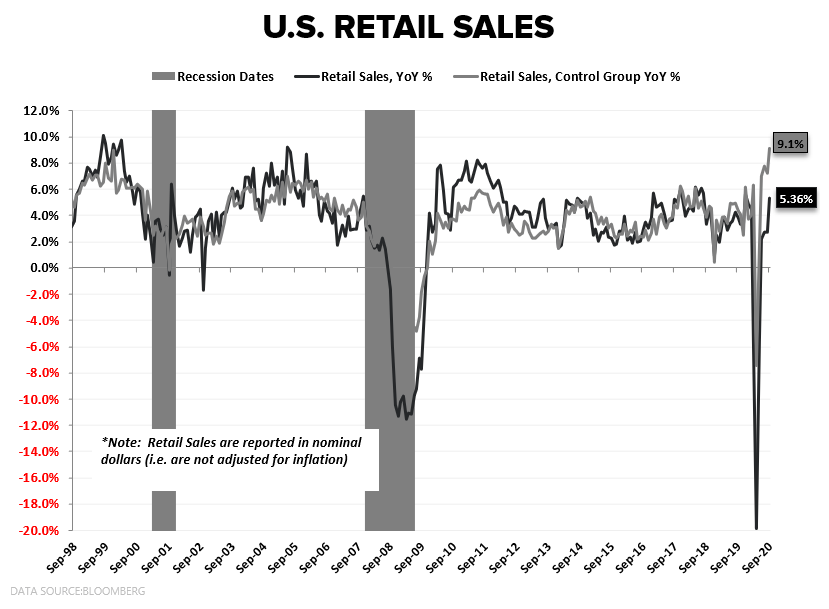
RETAIL SALES
In detailing the evolution in household spending in the peri-pandemic period, a compositional dynamic we’ve highlighted recurrently is that the combination of stimulus payments, enhanced U.I. benefits and WFH/lockdown initiatives all served to divert household spending away from Services and towards Goods Consumption (Retail Sales) – a dynamic that was on conspicuous display in 2Q/3Q and helped Retail Sales realize one of the few legitimate V-Shaped rebounds across the raft of high-frequency domestic macro series.
The outstanding question as we’ve pushed through 3Q is whether or to what extent consumption is re-normalizing and whether here-to strength in collective domestic consumerism can hang in in the face of reduced unemployment outlays, full exhaustion of PPP support funds, fading labor market gains and a rolling expiration in forbearance programs.
September suggests household spending and retail-therapy mojo for a the collective COVID fatigued consumer remains stable, at least.
A few contextual highlights:
- Broad Strength: We knew the headline would get a boost from the rise in unit auto sales (Autos = ~20% of Total Retail Sales and were up +7.6% M/M), but improvement was largely ubiquitous with all the subaggregates accelerating on both a M/M and Y/Y basis.
- Control Group Rebound: After fading for 2 months and actually registering negative sequential growth in August, Control Group Sales (gdp input) rose +1.4% M/M and accelerated to +9.1% Y/Y.
- Seasonality: Typically, back-to-school shopping serves to boost August sales with some measure of hangover in September … a dynamic that seasonal adjustments are meant to correct for (i.e. the seasonal adjustment supports the September reading). Indeed, NSA sales were down -2.8% M/M but accelerated +680 bps to +7.1% Y/Y, suggesting statistical distortion was not the primary factor influencing the Headline reading.
Some additional considerations:
- Savings: Household Savings spiked into the heart of lockdown efforts and stimulus disbursements. One of the unresolved debates was the relative concentration of that savings. That is, if the increased savings was concentrated among wealthy households, any drawdown would be less likely to support consumption broadly. If, however, the increase was relatively diffuse, a drawdown would help to support consumption in the face of declining benefit/stimulus income. We’ll have to wait on the official Savings Rate data later in the month but September Retail Sales suggest some measure of relatively broad savings decline.
- Services Stall: With Services activity stalled and virus activity re-percolating it could also be that we are continuing to see a disproportionate stenting of discretionary spending away from Services and towards goods, leaving total Consumption flattish … although, again we’ll have to wait on the PCE data later in the month to delineate mix effects.
- October/Prime Day Distortion: The shift of Amazon Prime day to October (and similar, forced moves out of other retailers) may add positive distortion to next months reported Sales. With total holiday related spend mostly fixed, this will simply sit as pull-forward/timing effect despite any ebullience that may accompany the headline release .
Of course, drawing down savings is not the same as an organic, broad based acceleration in income capable of driving durable improvement in collective consumption capacity.
That pseudo-nuance, however, will likely be lost on anyone already opposed to incremental, large-scale stimulus.