CHART OF THE DAY: Consumption Capacity ↓
10/02/20 08:24AM EDT
Below is a chart and brief excerpt from today's Early Look written by Macro analyst Christian Drake.
|
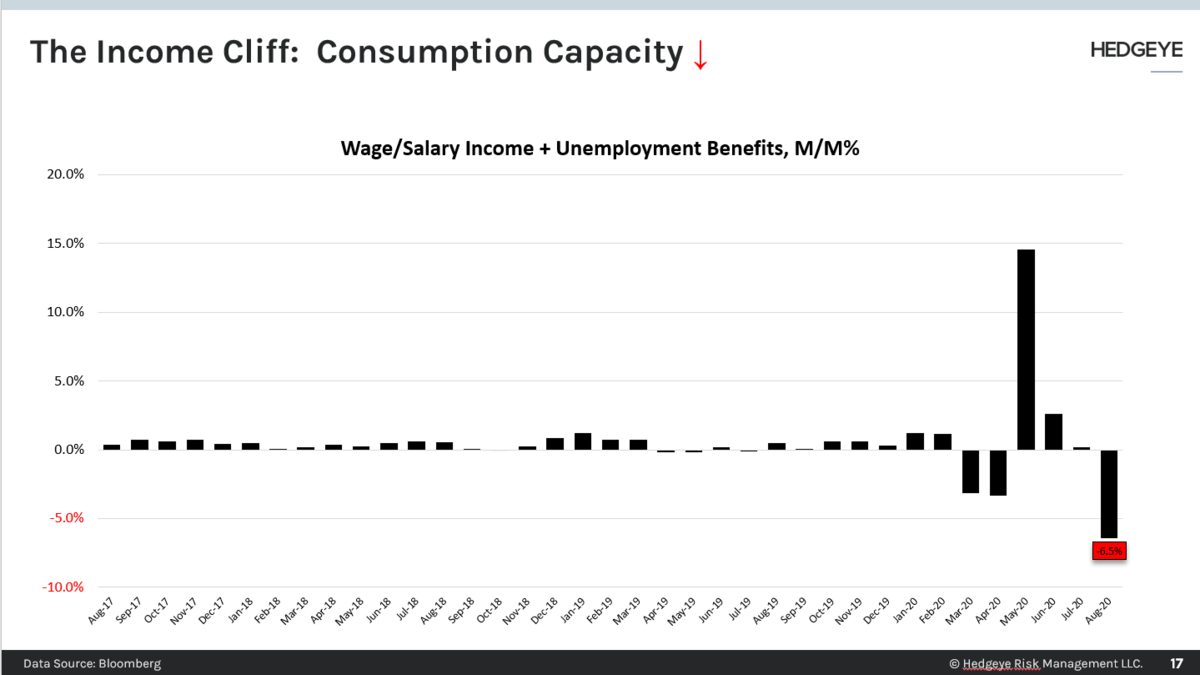
Household Spending:
- Personal Income: Total Personal income fell -2.7% M/M, but more notably...
- Consumption Capacity – the sum of Wage/Salary Income + Unemployment Benefits - fell -6.5% M/M.
- This is the emergence of the collective income cliff and the risk to a stalling in the consumption economy absent further stimulus.
And lastly, just to leave you with some perfect K-shaped juxtaposition.
Last month was simultaneously the best month ever for IG issuance and among the worst months ever for bankruptcies and business closure. Simultaneously the best month ever for home sales and record high levels of housing and food insecurity.
|

© 2024 Hedgeye Risk Management, LLC. The information contained herein is the property of Hedgeye, which reserves all rights thereto. Redistribution of any part of this information is prohibited without the express written consent of Hedgeye. Hedgeye is not responsible for any errors in or omissions to this information, or for any consequences that may result from the use of this information.