This insight was originally published on May 28, 2010. MACRO intra-day updates are available to RISK MANAGER SUBSCRIBERS in real-time.
MACRO: HOUSING IS STRUGGLING COMING OUT OF THE POST-EXPIRATION BLOCKS
________________________________________________________________________
Housing Datapoints Emerge Suggesting the Post-Tax Credit Expiration Decline Has Begun
We had theorized that housing would drop significantly after the tax credit expiration in April, as it did following November's tax credit expiration, and now we're getting early data to confirm that view. Yesterday, the herd drove housing-related equities modestly higher on a strong New Home sales print and Bob Toll's upbeat commentary. This was in spite of surprisingly high (and rising) existing home inventory and falling home prices (see our notes from Monday and Tuesday). The reality, however, is that since the end of April, demand in the housing market have been deteriorating.
The following chart shows MBA Mortgage Purchase applications indexed to 100 on January 1, 2010. On this basis, average applications in March were up 13.8% from the start of the year, and average applications in April were up 23.2% from the start of the year. In the first 3 weeks of May, however, applications were down 14.4% from levels in April. More striking is the fact that the most recent datapoint - May 21 - is down 25.6% from the average April level. Here's what the MBA's chief economist had to say following the release of the 5/14 data:
Purchase applications plummeted 27 percent last week and have declined almost 20 percent over the past month, despite relatively low interest rates. The data continue to suggest that the tax credit pulled sales into April at the expense of the remainder of the spring buying season. In fact, this drop occurred even as rates on 30-year fixed-rate mortgages continued to fall, and at 4.83 percent are at their lowest level since November 2009.
By the way, the week after the above comment was made - 5/21 - was the lowest weekly mortgage purchase application volume week since 1997. It's an interesting theoretical question to ask whether volume was down because of the pull-forward, the sharp stock market correction or a combination of the two.

The next chart shows Toll Brothers sequential change in buyer traffic from April to May. Bob Toll's comments in the quarterly earnings release yesterday were very positive, generating understandable investor enthusiasm towards not just TOL but the whole space. See Bob's comments below.
It appears our business has finally emerged from the tunnel and into a bit of daylight. For the third consecutive quarter, our signed contracts per community exceeded both of the previous two years' comparable-quarter totals. Deposits and traffic per community have been trending positively for the last four-, eight- and twelve-week periods. And our conversion percentage rate from traffic to deposits (non-binding reservations) was the highest second-quarter total since we began tracking this data in 1994. In the three weeks since the start of our third quarter on May 1st, which coincided with the expiration of the homebuyer tax credit, our per community deposits and traffic were up 23% and 11%, respectively, over last year's comparable period. May's activity suggests that for us the tax credit wasn't the determinative factor – rather, we believe, the past few months' activity has been driven by an increase in confidence among our buyers in their job security, their ability to sell their existing homes, and general trends in home prices.
One important fact check supplied during the Q&A portion of the call, however, revealed that year-over-year growth in buyer traffic - traffic is among the best leading indicators for housing - actually declined by two-thirds in May vs April. See the chart below. The +11% yoy May increase in buyer traffic cited in the release actually compared with a +25-30% increase in April. Suffice it to say that in spite of their claims, Toll is seeing a marked slowdown in activity following the tax credit expiration.
It's also worth pointing out that Toll Brothers houses are not representative of the country. For reference, their average ticket is in the $700,000-725,000 range, which puts them right at the cap of conforming loan limits: $729k for the highest priced markets. Considering Fannie and Freddie together accounted for over 95% of all mortgages issued last year, we would submit that the Toll Brothers addressable market does not reflect demand trends for better than 90% of the housing market.

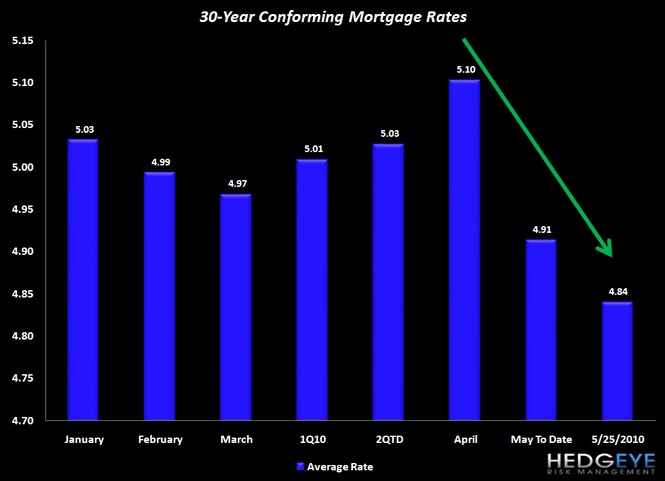
One striking consideration is that mortgage rates are at incredibly low levels. The 30-year conforming mortgage went out at 4.86% last night, down from a recent peak of 5.25% on April 4. The following chart shows average mortgage rates by month and for quarters going back to the start of the year. The drop in mortgage rates in May is striking. May is down 19 bps, on average, vs April. While the current rate of 4.86% is down 24 bps from the average April rate. In spite of this, purchase applications just posted their lowest reading since 1997.
The bottom line is that May data is starting to trickle in and so far it is very weak. We don't think the market yet appreciates how weak this May data is, but it will figure it out soon enough. In the interim, we offer the following chart that we published recently showing lenders stacked in order of relative exposure to residential real estate by combining residential first lien mortgages, second lien mortgages, HELOCs and 1-4 Construction loans. We think that as the market shifts its focus from the EU and Financial Reform to the worsening state of the housing market this summer it will put pressure on those companies with the greatest credit exposure to housing.

To summarize, here are the negatives on housing at the moment:
- May purchase applications are at a record low.
- Toll Brothers traffic index goes from +25-30% yoy in April to +11% in May.
- April existing home sales data showed a ballooning of inventory (a leading indicator) in spite of a rise in sales.
And here are the positives:
- New home inventories are very low.
We think the negatives pretty clearly outweigh the positives here, and we would recommend caution for longs and bearishness for those with short capabilities on all companies with a high degree of sensitivity to home prices heading into the back half of this year.
Now for the silver lining
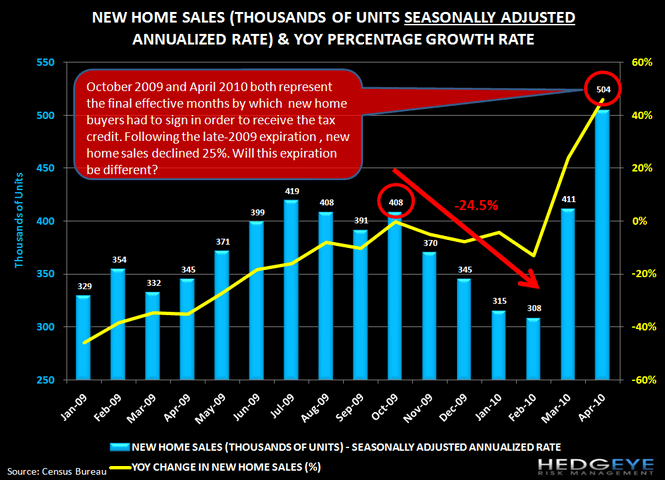
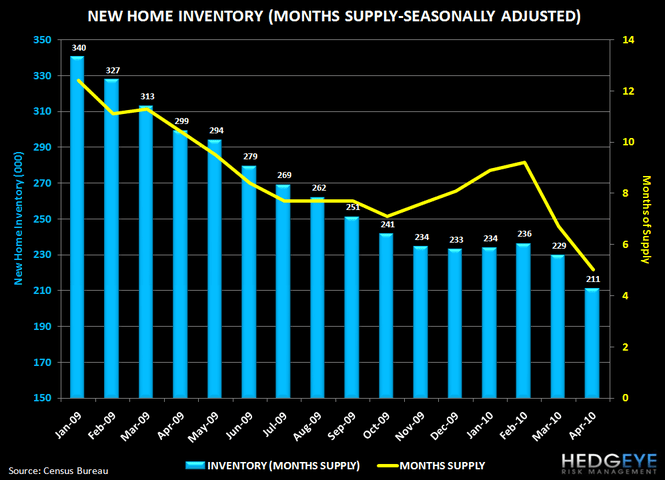
The April New Home sales data out yesterday was really exceptionally strong, as one would expect in the final month before tax credit expiration. Sales came in at a 504k annualized rate, +22.6% from the prior month and up 46% from the year earlier, and way above consensus. There's no debating that this was an exceptionally strong result. Moreover, inventory of new homes is down a lot. From a units perspective, new home inventory is reported at 211k, down almost 8% from last month's 229k print. The equally important months supply calculation fell to 5.0 months, down from 6.7 months last month. This had more to do with the huge pickup in sales activity than it did with the decline in inventory, but nevertheless the months supply reading for April was very strong.
The catch is that unlike existing home sales, which measure contract closings, new home sales measure contract signings. In other words, while we'll continue to see existing home sales prints rise for the next two months (a lagging indicator), for new home sales April was it - the end of the good prints. We're now on the backside of the tax credit expiration. If inventories weren't so low we would be bearish on the homebuilders. We expect competitive pressure from the existing home market to weigh on new home sales volume and pricing. That said, the low inventories make the short case quite challenging. We'll have to wait and see how the new home market evolves.
The following are several charts related to new home sales that we think tell the story of this month's data.
As mentioned before, new home sales were exceptionally strong in April.
Inventories also fell considerably.
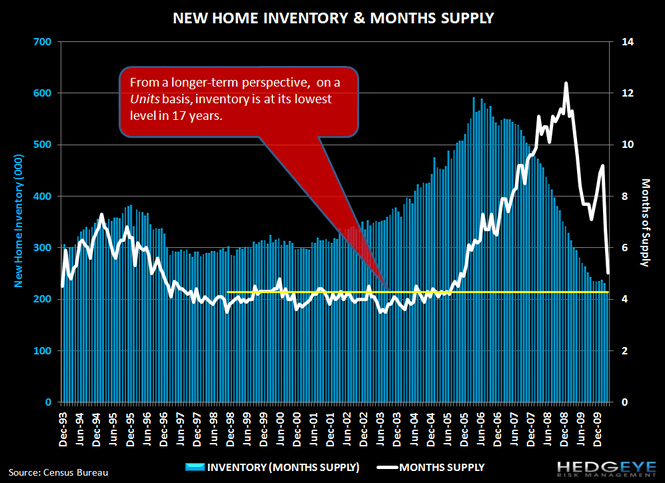
From a longer-term perspective, inventories on a units basis are at all time lows, while on a months supply basis, they are near their lows.
We include the following chart more as a reference point. It shows the share of total home purchases represented by new homes. The chart would suggest that the new home sales share is quite depressed by historical standards, and the more likely of the two outcomes would be for some degree of mean reversion to kick in. In other words, it would seem more likely than not that new home sales would gain share from here than that they would lose share. That being said, the world has changed in the last few years and we're still unclear on the extent to which things are going to go back to business as usual. As such we're still cautious in assuming that this penetration should bounce right back to 14-16% - a common refrain from investors long the builders.

Joshua Steiner, CFA
Managing Director
Allison Kaptur
Analyst
