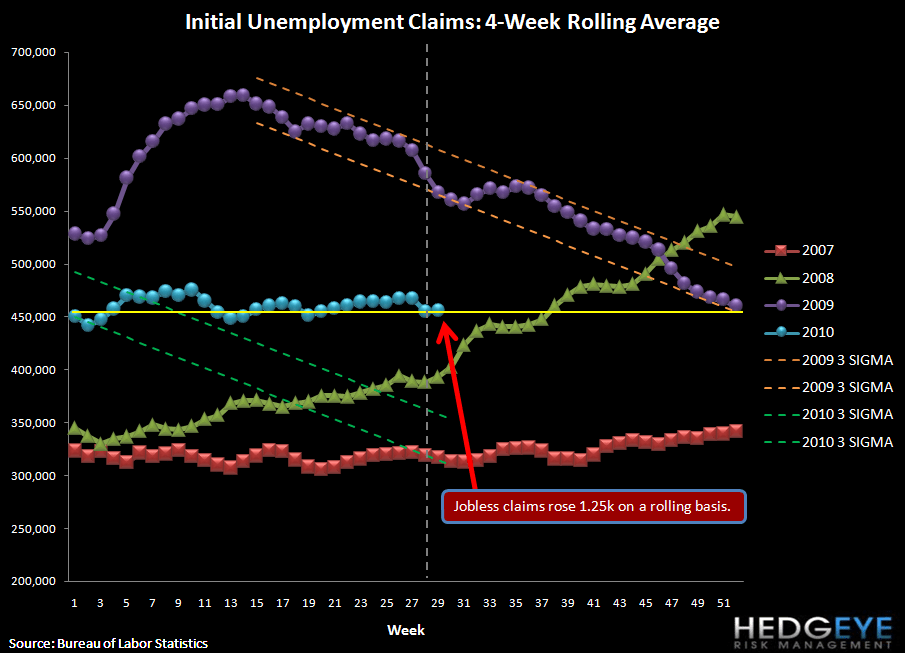
Initial claims rose by 37k last week (39k net of the revision), the largest jump since May of 2009. This comes on the heels of the prior week’s decline of 29k, which was the largest improvement since February of this year and the lowest weekly number since mid-08. At 464k, the number reported today is right back in line with the 450-470k range the series has occupied for all of 2010. On a rolling basis, the deterioration was more modest, rising 1.25k to bring the rolling total to 456k. We note that there seems to be significant seasonal volatility at work, as similar gyrations appeared this week in 2008 and 2007 (see the second chart below). Ultimately, initial claims need to be in the 375-400k range before unemployment meaningfully improves.

Below the jobless claims charts, we show the correlations between initial claims and each of the 30 Financial Subsectors. To reiterate, Credit Card and Payment Processing companies show the strongest correlations to initial claims, with R-squared values of .62 and .72 over the last year, respectively. Surprisingly, some subsectors show a positive correlation coefficient to initial claims - i.e. Financials that go up as unemployment claims go up. These names are concentrated in the Pacific Northwest Banks and Construction Banks, though these correlations are usually not very high.
In the table below, we found the correlation and R-squared of each company with initial claims, then took the average for each subsector. For composition of the subsectors, see Chart 5 below.
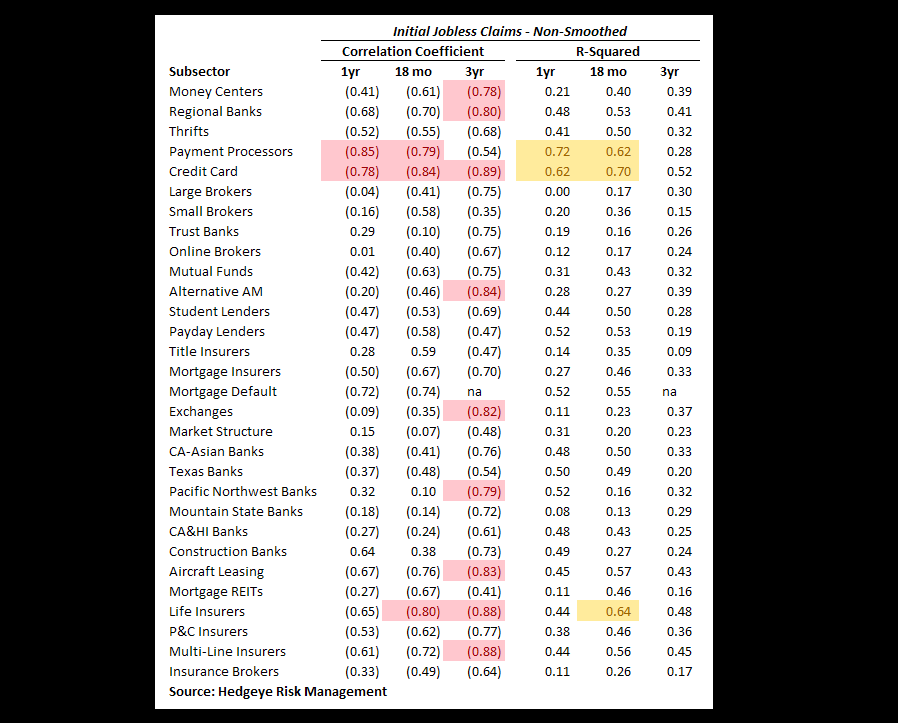
The following table shows the most highly correlated stocks (both positively and negatively correlated) with initial claims. Note that the top 15 negatively correlated stocks have a much stronger correlation on average than the top 15 positively correlated stocks - as you would expect, given that most of the Financial space is pro-cyclical.

Astute investors will note that in some cases the R-squared doesn't seem to reconcile with the square of the correlation coefficient. This is a result of finding the correlation and then averaging. For example, Pacific Northwest Banks have an average correlation coefficient of .32 and an average R-squared of .52 (with CACB, CTBK, FTBK, and STSA strongly positively correlated and UMPQ strongly negatively correlated). The different directions have the effect of canceling out each other out when finding the average correlation coefficient, but do not cancel out when finding the average R-squared.
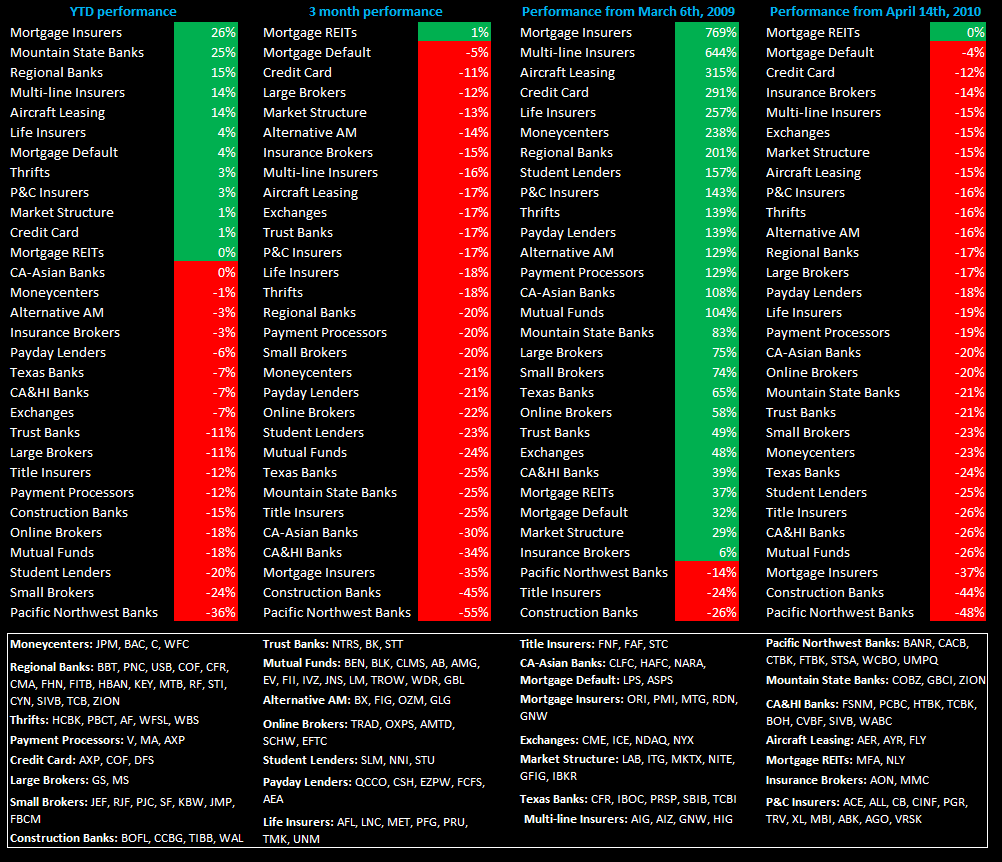
The table below shows the stock performance of each subsector over four durations.
As a reminder, May was the peak month of Census hiring, and it will remain a headwind through the September data as the Census continues to wind down.

Joshua Steiner, CFA
Allison Kaptur
