CHART OF THE DAY: What Happens When Consensus Chases Linear Recovery Expectations

07/02/20 07:50AM EDT

Below is a chart and brief excerpt from today's Early Look written by Hedgeye CEO Keith McCullough.

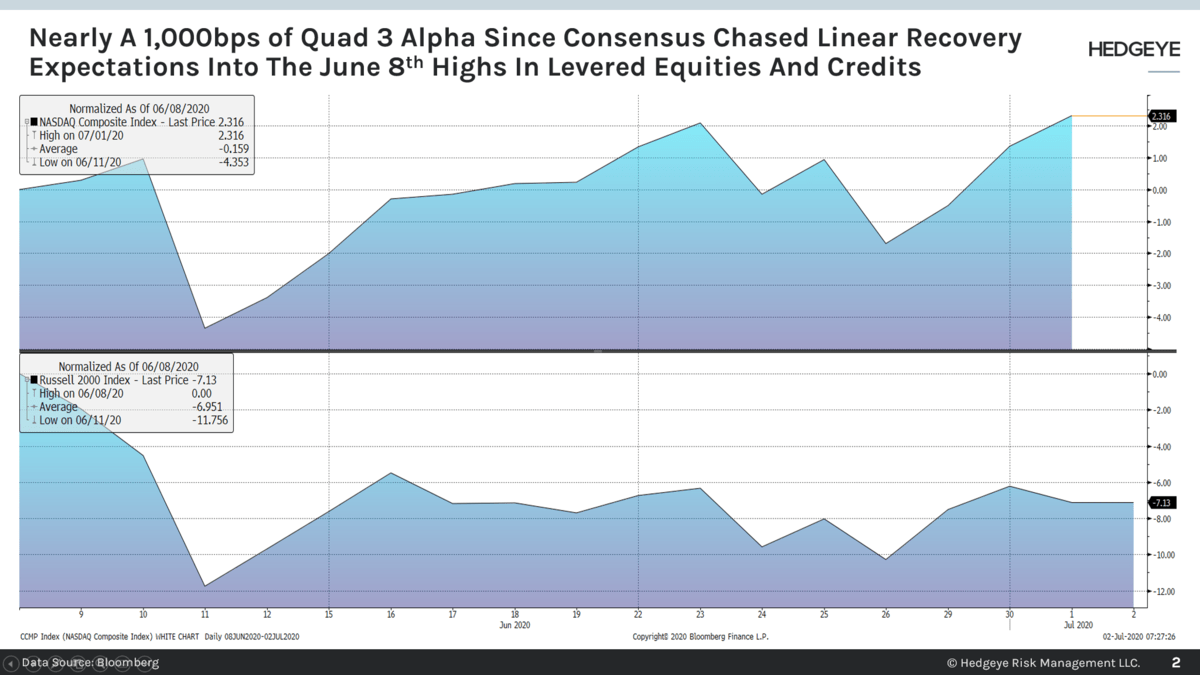
Yesterday was a great example of where being long “the market” (which means absolutely nothing to me, unless defined from a Global Macro perspective) got crushed by being long and short the right components of major markets.

If all you were looking at was the US Equity market (please don’t!):

A) NASDAQ +1% to an all-time closing high vs.
B) Russell 2000 down -1% to -18% from its Cycle high

That made complete sense as the NASDAQ and/or Secular Growth is a long during #Quad3 Stagflation whereas Small Cap, as a Factor Exposure, is an underweight or short.

CHART OF THE DAY: What Happens When Consensus Chases Linear Recovery Expectations - Chart of the Day

© 2024 Hedgeye Risk Management, LLC. The information contained herein is the property of Hedgeye, which reserves all rights thereto. Redistribution of any part of this information is prohibited without the express written consent of Hedgeye. Hedgeye is not responsible for any errors in or omissions to this information, or for any consequences that may result from the use of this information.