|
Editor's Note: This is a complimentary research note published by Director of Research Daryl Jones on June 25th. CLICK HERE to get COVID-19 analysis and alerts from our research team and access our related webcasts. |
“Please allow me to introduce myself
I'm a man of wealth and taste
I've been around for a long, long year
Stole many a man's soul to waste.”
-“Sympathy for the Devil”, The Rolling Stones
KEY TAKEAWAYS
- We’ve been asked a lot of questions about why we focus on daily new cases. Primarily we do this because daily new cases, when starting to trend, are a leading indicator for further spread, hospitalizations, deaths, and policy implementation.
- Yesterday, the U.S. hit a new daily high in new cases at over 40,000. This is being driven by a R0 over 1 in around 30 states and key breakouts in Florida, Texas, California and Arizona. Clearly, the re-opening has increased transmission broadly across the country along with other factors like proximity to Mexico, increase in work place testing, and specific localized breakouts.
- Globally, daily new cases hit their second highest level at just over 172,000 and continue on their upward trend. If anything the proverbial curve globally is steepening around the world.
- There is really no change in both Europe or developed Asia as case-loads remain very low and the partial lockdown in Beijing appears to be limiting spread.
- The emerging markets continue to largely go from bad to worse. Brazil, in particular, has printed two days in a row with over 40,000 new cases.
The U.S. Situation
The hammer of extreme social distancing in the U.S. was effective in slowing spread and lowering positive test rates on the back of vastly reduced mobility. As we’ve written though, the U.S. never got to a point where spread was largely extinguished, as it was in Europe and Asia, prior to re-opening.
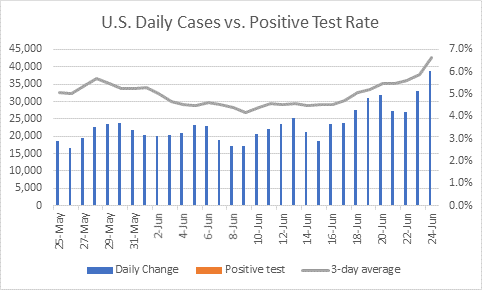
In the chart below we look at daily new cases versus the positive test rate. Much has been made about the fact that as testing increases cases should naturally go up (more asymptomatic cases being discovered) and there is some validity to this. But we are now also seeing an increase in the positive test rate at the same as tests are increasing.
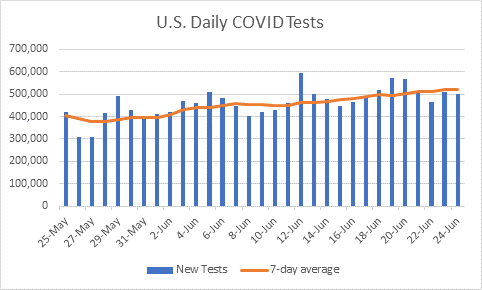
As a compliment to the chart above, in the chart below we look at the trend of new daily tests over the same period. The takeaway is obvious in that we are now in a phase of higher testing, higher new daily cases, and, also, higher positive test rates.
Currently in the U.S. we have 30 states with a R0 above 1. Two months ago during massive nation-wide shutdowns this was at 5. The Northeast is by far the lowest with MA, DC, CT, VA, and NJ having the lowest in the country.
- NY is an interesting one that has seen its R0 ticking up steadily and will be important to watch.

The biggest risk is that hospitals eventually get overwhelmed. We do not see that risk in the intermediate term, but it is valuable to look at hospitalization in the States that are currently adding the most cases:
- Texas Hospitalizations up 157% in the last week currently at 4,389 and new highs
- Arizona currently at 2,270 beds occupied by COVID-19, 86% of inpatient beds and 88% of ICU beds. Up over 100% week-over-week
- Florida doesn’t disclose the data as accurately, but as far as we can tell hospitalizations are near all-time highs, though appear to be increasing slower than Texas and Arizona
- California currently has 4,095 hospitalized and 1,268 in ICU and is at an all-time high
- North Carolina, South Carolina, and Tennessee are also at all-time highs in hospitalizations
Obviously, we need to put the increase in some states in context to their population. On a population adjusted basis, Arizona looks by far the worst.

Rest of the World
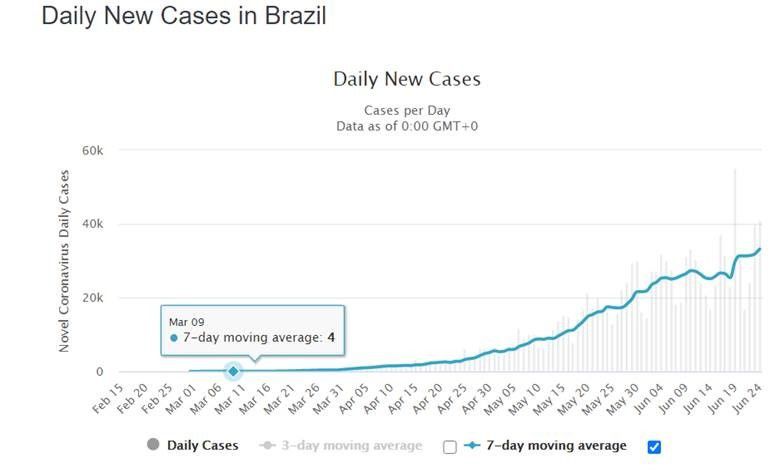
The emerging markets, and we sound like a broken record, are seeing very little reprieve. Below we again show the chart from Brazil and while on the margin the growth rate of daily cases is slowing, the moving average of daily new cases grinds higher. The last two days Brazil has added more than 40,000 cases on each day, which on a population adjusted based is more than any other major country.
- Testing has picked up a lot in Brazil, which will eventually be a positive and is driving some of the increase in cases.
India has moved into fourth place globally in terms of COVID-19 infections and continues to grind higher as we see daily new highs almost every day. India continues to test at very low rates, 5,480 per million, which is on par with Mexico and 18x less than the U.S.
- India reminds us a bit of the worst days in Italy when hospitals were completely overwhelmed. Good article here that discusses that.
- India went into lock down on March 25th, eased restriction by the third week of May, and cases started rising by early June
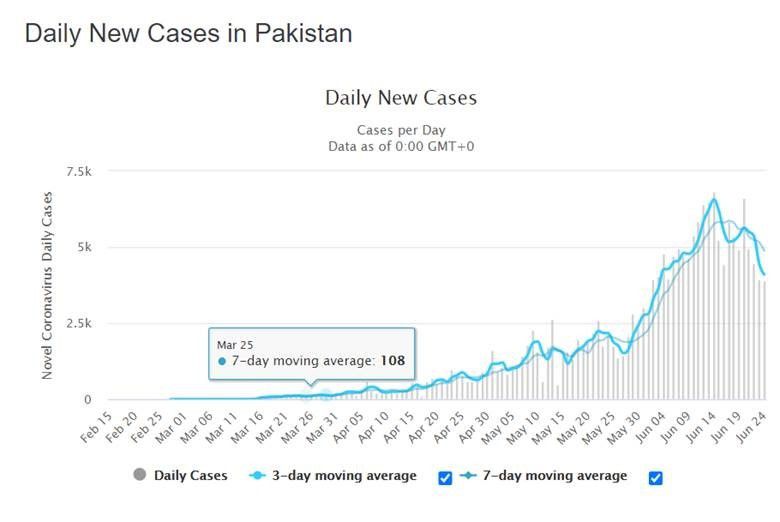
Interestingly, Pakistan appears to have peaked a few weeks ago. The caveat being the test rate is really low, so the total infected population is likely substantially higher. The dichotomy between the India and Pakistan will be interesting to watch, either the data quality is much worse coming from Pakistan or they are doing something much better than India
- Interesting read on Pakistan
South Africa is the one major country that appears to have the most exponential increase in daily case growth at the moment. The 7-day moving average has increased about 30% in South Africa from a week ago.
- The rest of Africa is more difficult to discern as testing rates continue to be minimal. As an example Egypt has the second most cases in Africa at 59,561, but has only tested 1,320 people per million. Overall the positive test rate is north of 40%
Europe and Asia Situation
Now for the good news, Europe and developed Asia are looking great. Likely the combination of masks, sufficient testing, quarantines, social distancing, and so on, but the outcomes are across the board are positive.
In the chart below, we take a look at the U.K. versus the U.S. on daily new cases population adjusted (apples to apples). We picked the U.K. as it improved the slowest in Europe and as you can see it is on a startingly different (and more positive) path than the U.S.
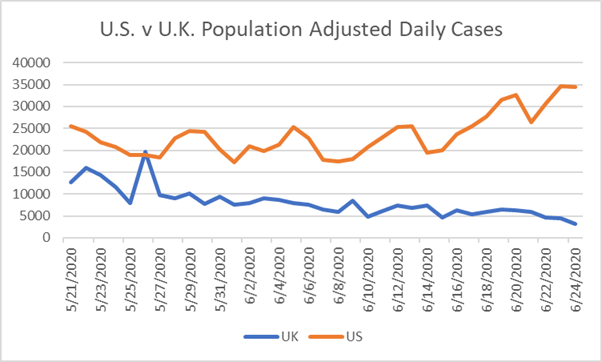
This is a similar story across Europe as the combination of France, Spain, Germany, U.K., and Italy, as an example, only reported about 1,700 new cases versus 40,000+ in the U.S. on similar population bases in the last 24 hours.
There is not a lot to report from Asia. Based on the reported numbers, they have this figured it out in a big way. By and large they are reporting less than 100 cases per day per major country.