This guest commentary was written by Mike Shell. It was originally published on ASYMMETRY® Observations on 6/10/20.

If we’re going to see a second leg down, this is where I think it will start. The US stock market is now at risk of another decline.
First, the relative strength of the S&P 500 has reached a level I consider overbought for the first time since the crash.

It’s a measure of too far, too fast.
The Relative Strength Index (RSI), developed by J. Welles Wilder. Born in Noris, Tennessee, Wilder was a mechanical engineer, turned real estate developer, turned technical analyst, and best known for his work in technical analysis.
Wilder created the Average True Range, the Relative Strength Index (RSI), Average Directional Index, and the Parabolic SAR, which he published in 1978 in New Concepts in Technical Trading Systems.
is a momentum oscillator that measures the speed and magnitude of directional price trends. The RSI oscillates between zero and 100, so it is range bound.I The RSI is defined as overbought when it reaches 70 or higher and oversold below 30.
Another useful measure of market trend conditions is breath. The percent of S&P 500 stocks above their 50 day moving average shows us how many stocks are participating in the uptrend.
Since June 1st, 97% of the stock are trending above their 50 day moving average, so they are in short term uptrends.
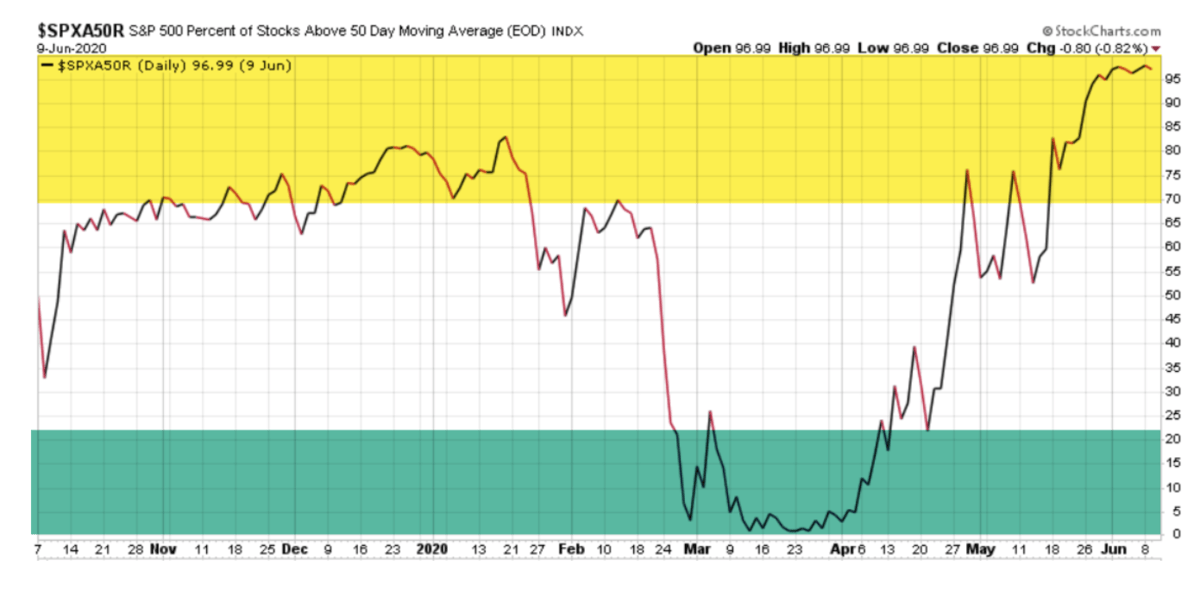
Strong breadth of participation is a good thing, until it reaches an extreme. A breath thrust as we saw begin the start in April was a good sign as the stock market was trending up, more and more stocks were entering uptrends.
However, once all of the stocks are already in uptrends, we eventually have to wonder what is going to keep driving them higher.
Much of investment management is an understanding of what other market participants are likely to do next.
When I see the percent of SPX stocks above their 50 day moving average at the highest level in twenty years, it simply tells us most of the stocks are in short term uptrends, but, the next direction for buying enthusiasm is going to be down.

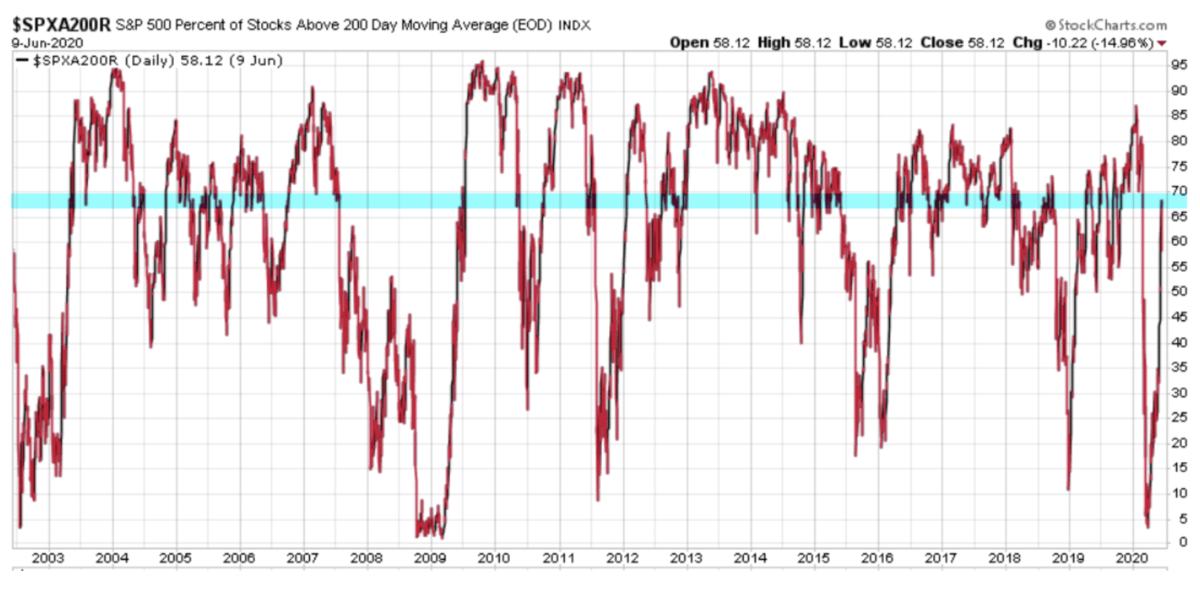
On a longer term time frame, which is the 200 day moving average, only about 60% of the S&P 500 stocks are in longer term uptrends, so there is plenty of room for continuation.
Next up is the good ole NYSE Bullish Percent.
The NYSE Bullish Percent was the first breadth indicator. The NYSE Bullish Percent was developed by Abe Cohen, the founder of Investors Intelligence in 1955. Abe Cohen was an early pioneer of point & figure charting , which he believed provided the ideal building blocks for a market barometer. By recording stock prices, P&F charts effectively map out the relationship between demand (buyers) and supply (sellers). The advantage of P&F charts is the supply/demand asymmetries are clear cut and easy to identify:
If demand outstrips supply, a P&F buy signal is generated
If supply outstrips demand a P&F sell signal is generated.
The Bullish Percent, then, is a breadth indicator that shows the percentage of stocks on Point & Figure Buy Signals. As with other oscillators, the Bullish Percent Index is range bound and fluctuates between 0% and 100%. In its most basic form, the Bullish Percent Index favors the bulls when above 50% and the bears when below 50%.
Bullish Percent is considered overbought and a higher risk zone when above 70% and oversold and a lower risk level when below 30%.
At the current reading of 83, it’s clearly in the “high risk” zone.

So, I wouldn’t be surprised to see this uptrend at least stall here, temporarily.
If we’re going to see a second leg down, this is where I believe it will start.
The Federal Reserve is fully committed to keeping this trend going, so we’ll see…
ABOUT MIKE SHELL
Mike Shell is the founder of Shell Capital Management, LLC and the portfolio manager of ASYMMETRY® Global Tactical and ASYMMETRY® Managed Portfolios.
This piece does not necessarily reflect the opinion of Hedgeye.
