Below is a chart and brief excerpt from today's Early Look written by Hedgeye CEO Keith McCullough.
|
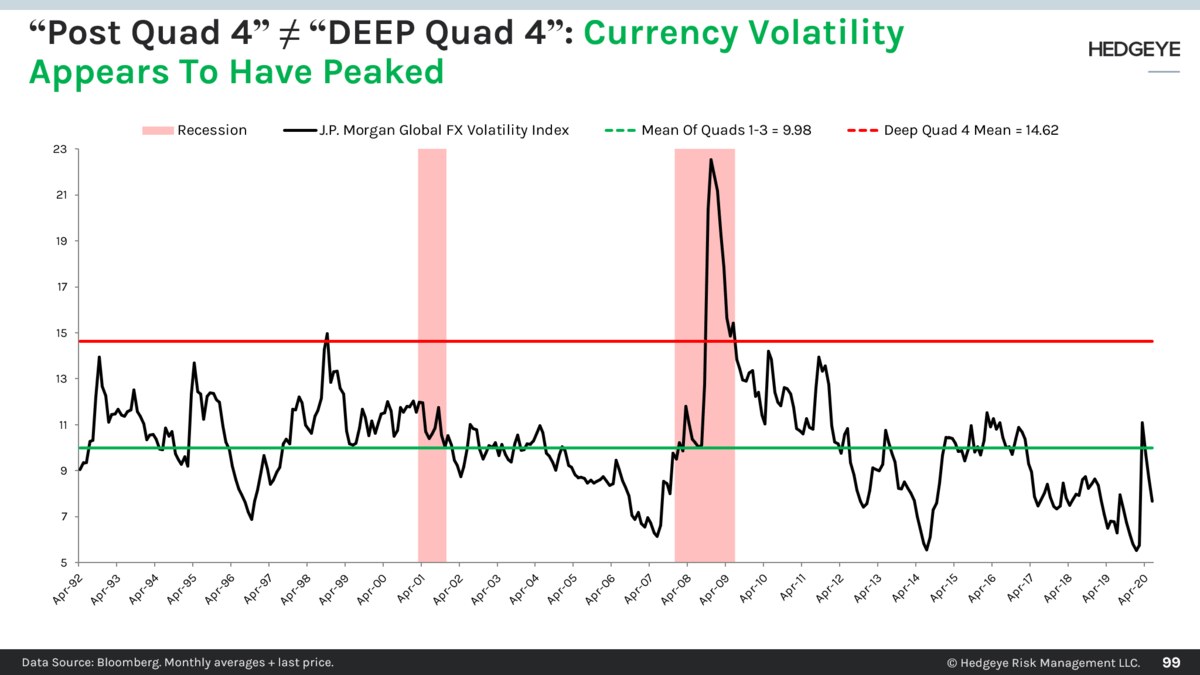
So let’s get on with that and focus on last week’s critical Phase Transition (i.e. when my market signal suggests we’re moving from one TREND to another) in the Global Currency market: A) US Dollar Index dropped -1.4% last week, breaking bad to Bearish TREND Since my quant signals don’t undergo a Phase Transition unless the volatility of the asset’s price does, these often take long Cycle Time to play out. FX Volatility dropped -4.2% last week, taking its 1-month momentum to -17.6%. That was enough to break what’s been Deep #Quad4 US Dollar support. As a reminder, the only plain vanilla Quad that backtests as USD Bullish is #Quad4. Our recent analysis suggests a Deep #Quad3 could be USD bullish as well. |